Invented by Acer’s visionary co-founder Stan Shih in the late 1990s, the Smile Curve revolutionized how we understand the nature of manufacturing and distribution.
In this post, we will examine its economic consequences, the impact of globalization on the distribution of value, and its impact on industries and policymaking.
In addition, we draw fascinating parallels between the Smile curve and the data lifecycle, showing how value is captured at different points, from data genesis to its strategic use.
This article will introduce you to the perspective of innovation , production, branding, and customer care. You will also learn more about the subtle dynamics of products and ideas.
The Smile Curve Concept
Ever wondered how the value of a product is distributed across its journey from conception to the hands of consumers? Enter the fascinating concept of the Smile Curve, a visual representation that sheds light on the dynamic stages of value creation.
Coined by Stan Shih, the visionary co-founder of Acer, the Taiwanese electronics giant, in the late 1990s, this concept has revolutionized how we perceive the essence of production and distribution.
Imagine a graph where the horizontal axis maps out the production phases, and the vertical axis quantifies the value or profit yielded at each juncture. This graph, resembling a cheerful smile, hence its moniker, “Smile Curve,” has unveiled the secrets behind the intricate tapestry of product value creation.
Here’s a closer look at the pivotal stages that make up the smile curve:
1. Research and Development (R&D)
The inception of innovation, the birth of ideas, and the crafting of cutting-edge technologies define this phase. While R&D requires substantial investments and bears inherent risks, its success can lay the foundation for revolutionary products that shape the rest of the value chain.
2. Manufacturing
The heartbeat of tangible creation, the manufacturing phase, brings ideas to life. Often executed in regions with lower labor costs, this labor-intensive phase can influence the value added, contingent on the intricacy of the production process.
3. Marketing and Branding
Branding and marketing appeal are the center of attention at Smile Curve. Creating a distinctive brand identity and skillfully marketing the product to the target audience can increase its perceived value and strengthen market demand.
4. Design and Distribution
Packaging, logistics, and seamless distribution define this stage. An efficient design and distribution strategy can propel products swiftly and cost-effectively into their intended markets.
5. Retail and Sales
Peak shopping marks this stage, whether through brick-and-mortar stores or digital platforms. By examining and analyzing the Smile Curve, thoughtful sales strategies can increase product value by appealing to a broader audience.
6. After-Sales Service and Support
The grand finale entails customer support, warranties, repairs, and upkeep. Exceptional after-sales services foster customer loyalty and cultivate positive brand associations.
Challenging the traditional belief that manufacturing is the paramount value generator, the Smile Curve presents a paradigm shift. It underscores that substantial value emerges from a product’s lifecycle’s early and later stages, such as R&D and post-sales support.
This curve underscores the pivotal roles of innovation, branding, and customer care in forging a competitive edge and nurturing profit generation.
However, noting that the Smile Curve isn’t universally applicable across all industries or products is crucial. Its shape can fluctuate based on the unique characteristics of each sector, specific products, and the strategies companies employ.
The Smile Curve is a compass guiding us through the intricate maze of value creation. It’s a tool that enables us to grasp a product’s journey, from its nascent spark of innovation to becoming a cherished item in the hands of satisfied customers.
Smile Curve Theory Origins
The Smile Curve Theory is an interesting concept that you might find quite insightful. It was first introduced by Stan Shih, the founder of Acer, a Taiwanese multinational hardware and electronics corporation, in the early 1990s.
Shih noticed that the value-added and profitability in the production chain of information technology products tend to be higher at the ends and lower in the middle.
Imagine a smiley face: the two ends of the smile represent the high-value areas like research & development (R&D) and branding, while the dip in the middle represents the lower-value areas like manufacturing and assembly.
This theory highlights that companies focusing on innovation, design, and brand management tend to capture more value compared to those involved in just the manufacturing processes. It has since been applied beyond the tech industry to understand value distribution in various sectors.
The smile curve: Firm-level versus economy-wide conceptualization
Economic Insights and Smile Curve
Indeed, let’s delve into the economic implications of the Smile Curve concept. The Smile Curve isn’t just a visual representation; it’s a framework that carries economic insights regarding value creation, globalization, and competitiveness.
Value Distribution
The Smile Curve challenges conventional assumptions about where the production process generates the highest value. Traditionally, manufacturing was thought to be the primary source of value.
However, the curve suggests significant value is added during the R&D, marketing, branding, and after-sales stages. This insight has implications for resource allocation and investment decisions within companies.
Globalization and Comparative Advantage
The Smile Curve sheds light on how globalization has influenced the distribution of value-added stages across different countries. Labor-intensive manufacturing often occurs in countries with lower labor costs, while high-value R&D and branding activities may be concentrated in more developed economies.
That reflects the principle of comparative advantage, where countries specialize in activities where they have a relative advantage.
Competitive Advantage
Understanding the Smile Curve can help businesses identify opportunities to build competitive advantages. Companies can focus on strengthening their capabilities in R&D, branding, and customer support to create differentiation in the market.
That goes beyond competing solely on price, as enhancing value-added stages can lead to higher margins and customer loyalty.
Innovation and Intellectual Property
The Smile Curve underscores the critical role of innovation in value creation. R&D activities, situated at the beginning of the curve, drive technological advancements and the creation of intellectual property.
Protecting and leveraging these intellectual assets becomes crucial for companies aiming to capture value in subsequent stages.
Supply Chain Management
Efficient supply chain management becomes imperative to ensure the seamless movement of products through various stages of the Smile Curve. Companies must optimize logistics, distribution networks, and inventory management to minimize delays and costs.
Consumer Behavior and Perception
The Smile Curve also relates to how consumers perceive and value a product. Effective marketing and branding increase a product’s perceived value, influencing consumers’ willingness to pay. Positive after-sales service enhances customer satisfaction and loyalty, adding to the value proposition.
Policy Implications
Governments can use the insights from the Smile Curve to inform policies that encourage innovation, education, and skills development. They can also create an environment that protects intellectual property and fosters collaboration between research institutions and businesses.
Industry Evolution
Industries can evolve along the Smile Curve. For example, as economies develop and labor costs rise, manufacturing might shift to more value-added activities like design and R&D. This will lead to economic growth and higher living standards.
In essence, the Smile Curve concept is a lens through which economists and businesses can examine the dynamics of value creation and the interplay of different stages within the global economy.
It offers a more nuanced understanding of where economic value originates and how it can be harnessed for growth, innovation, and competitiveness.
The Smile Curve and the Data Lifecycle
The Smile Curve, a concept symbolic of value distribution across product lifecycles, has an intriguing counterpart in the realm of data—the data lifecycle . Drawing parallels between these two frameworks unveils how value is harnessed at different junctures, from data inception to its strategic utilization.
Data Genesis and Collection
Much like the inception of innovation in the Smile Curve, the data lifecycle commences with data generation and collection. This phase, akin to the Research and Development stage, witnesses the birth of raw data from diverse sources, echoing the nascent spark of ideas.
Just as manufacturing shapes raw materials into tangible products, data processing, and transformation mold raw data into coherent, usable forms. Here, the data mirrors the Manufacturing phase, transitioning from chaos to structured information.
Insights and Revelation
The Marketing and Branding stage’s elevation of value finds its counterpart in data analysis. Extracting insights and patterns enhances data’s value by transforming it into actionable knowledge parallel to the market’s response to effective branding.
Visual Storytelling
Like the enchanting packaging that enhances a product’s allure, data visualization and presentation render insights accessible and visually captivating. These representations turn complex data into clear narratives, amplifying their value like well-packaged products.
Strategic Navigation
Data-driven decision-making, reflecting the sales and retail stage, has the potential to improve performance. Just as strategic selling increases the value of a product, proper analysis of the smile curve and informed decisions based on data insights can optimize operations and tailor marketing efforts.
Continuous Evolution
The data lifecycle’s refinement mirrors excellent customer care. Adapting data strategies based on feedback and evolving needs is akin to nurturing long-term loyalty.
Security and Trust
The emphasis on safeguarding customer trust aligns with the imperative of data security and compliance. Data privacy and compliance maintain stakeholder trust, just as secure transactions reassure consumers.
Monetization and Innovation
Like innovating for value creation in the product world, data monetization and innovation open avenues for value in the digital realm. Leveraging data to offer services or insights showcases a kinship with innovative product development.
Marrying the Smiling Curve’s wisdom with the data lifecycle unveils the dynamic stages of value realization.
Just as the Smile Curve asserts value isn’t confined to manufacturing, the data lifecycle emphasizes data’s richness extends beyond mere collection—it burgeons through effective processing, strategic application, and continual refinement.
Stages of production processes
Smile Curve Applications Inspiration
The Smile Curve Theory isn’t just a neat idea—it’s actually quite inspiring when you think about how it can be applied across different industries. Here are a few ways this concept has been utilized to drive innovation and business strategy:
Tech Industry : Companies like Apple and Google exemplify the Smile Curve. They invest heavily in R&D to develop cutting-edge technology and in marketing to build a strong brand. This strategy ensures they capture significant value at both ends of the curve.Fashion Industry : Brands like Nike and Zara focus on design and brand management. Nike, for instance, invests in innovative designs and extensive marketing campaigns to enhance brand value, while outsourcing manufacturing to keep costs low.Automotive Industry : Tesla is a great example here. Tesla invests massively in R&D to innovate electric vehicle technology and to build a powerful brand image. The manufacturing part, although critical, is where they try to optimize costs and efficiency.Food and Beverage Industry : Companies like Starbucks focus on creating unique recipes and a strong brand experience. They innovate with new products and heavily market their brand, while the actual production of coffee beans is outsourced.Consumer Electronics : Sony and Samsung invest in developing new technologies and in brand marketing. They often outsource parts of their manufacturing process to capture more value through innovation and brand strength.
By understanding and applying the Smile Curve, businesses can strategically focus their efforts on the most value-generating activities. Whether it’s through innovation, brand building, or efficient production, the Smile Curve provides a roadmap for maximizing profitability and staying competitive.
So, the next time you’re thinking about how to enhance your business or product, consider where you can add the most value. Maybe it’s time to put a bigger smile on your business strategy!
New Idea: Servicification of Manufacturing
The idea of “servicification of manufacturing” is like adding a new twist to the classic Smile Curve Theory. Imagine if manufacturing itself could be transformed into a service rather than just a production phase. Sounds intriguing, right?
Here’s how it could work and why it’s exciting:
Customization as a Service : Instead of just producing goods, manufacturers can offer customization services. Think about personalized products where customers can design their own gadgets, clothes, or even cars. This service-oriented approach can create a unique value proposition and deepen customer loyalty.Maintenance and Upgrades : Manufacturers can provide ongoing maintenance and upgrade services. For example, instead of selling a one-off product, companies could offer a subscription model that includes regular updates, repairs, and improvements. This not only ensures a steady revenue stream but also keeps customers engaged with the brand.Integrated Solutions : Companies can offer complete solutions rather than standalone products. For instance, instead of selling a machine, a manufacturer could provide a comprehensive package that includes installation, training, and 24/7 support. This approach transforms a single transaction into a long-term relationship.Data-Driven Services : With the rise of IoT and smart devices, manufacturers can gather data from their products to offer predictive maintenance services. This means fixing potential issues before they become problems, saving time and money for customers, and adding value beyond the initial sale.Sustainability Services : In a world increasingly focused on sustainability, manufacturers can offer recycling and eco-friendly disposal services. This not only appeals to environmentally conscious consumers but also enhances the brand’s reputation.Flexibility and Scalability : By focusing on service, manufacturers can be more flexible and scale their operations to meet changing demands. They can quickly adapt to new market trends and customer needs, staying ahead of the competition.
The servicification of manufacturing essentially means turning the manufacturing process into an ongoing service relationship rather than a one-time product sale. It’s about creating continuous value, building stronger customer relationships , and unlocking new revenue streams.
So, the next time you think about manufacturing, imagine it as a dynamic service ecosystem rather than just a production line. It could be the next big shift in how we create and deliver value in the modern economy!
Conclusion
In conclusion, the Smile Curve is a remarkable framework that has changed our understanding of value creation, challenging conventional concepts and offering a different perspective on the complex journey of products from conception to consumer’s hands.
Invented by Stan Shih, co-founder of Acer, this visual representation has changed our understanding of manufacturing, distribution, and the economic landscape.
Through our exploration of the economic implications of the smile curve, its implications for globalization, and its parallels with the data lifecycle, we saw how the concept transcends industries and domains.
The Smile Curve’s insightful depiction of value distribution challenges traditional paradigms and emphasizes that innovation, branding, and customer care play equal roles in enhancing competitive advantage and generating profits.
As industries continue to evolve along the smile curve, it becomes clear that pursuing value creation is a multifaceted endeavor.
The framework encourages businesses, governments, and economists to reevaluate strategies, invest in innovation, prioritize customer satisfaction, and adapt to changing market dynamics.
By combining the wisdom of the Smile Curve with the data lifecycle, we have expanded our understanding of value realization and revealed the remarkable parallels between the world of tangible products and digital data.
The smile curve acts as a compass, guiding us through the labyrinth of value creation, from ideation to market dominance.
It’s a concept that transcends industries, revealing the fundamental dynamics that drive products and ideas into the limelight and reshaping our understanding of what truly creates value in an ever-evolving global economy.
Sources:
{11239602:EFBVT4CT};{11239602:EFBVT4CT}
http://www.zotero.org/styles/elsevier-vancouver
default
asc
0
26369
%7B%22status%22%3A%22success%22%2C%22updateneeded%22%3Afalse%2C%22instance%22%3Afalse%2C%22meta%22%3A%7B%22request_last%22%3A0%2C%22request_next%22%3A0%2C%22used_cache%22%3Atrue%7D%2C%22data%22%3A%5B%7B%22key%22%3A%22KX8KYHUF%22%2C%22library%22%3A%7B%22id%22%3A11239602%7D%2C%22meta%22%3A%7B%22creatorSummary%22%3A%22Kleinaltenkamp%20et%20al.%22%2C%22parsedDate%22%3A%222023%22%2C%22numChildren%22%3A0%7D%2C%22bib%22%3A%22%26lt%3Bdiv%20class%3D%26quot%3Bcsl-bib-body%26quot%3B%20style%3D%26quot%3Bline-height%3A%201.35%3B%20%26quot%3B%26gt%3B%5Cn%20%20%26lt%3Bdiv%20class%3D%26quot%3Bcsl-entry%26quot%3B%20style%3D%26quot%3Bclear%3A%20left%3B%20%26quot%3B%26gt%3B%5Cn%20%20%20%20%26lt%3Bdiv%20class%3D%26quot%3Bcsl-left-margin%26quot%3B%20style%3D%26quot%3Bfloat%3A%20left%3B%20padding-right%3A%200.5em%3B%20text-align%3A%20right%3B%20width%3A%201em%3B%26quot%3B%26gt%3B%5B1%5D%26lt%3B%5C%2Fdiv%26gt%3B%26lt%3Bdiv%20class%3D%26quot%3Bcsl-right-inline%26quot%3B%20style%3D%26quot%3Bmargin%3A%200%20.4em%200%201.5em%3B%26quot%3B%26gt%3BKleinaltenkamp%20M%2C%20Prohl-Schwenke%20K%2C%20Elgeti%20L.%20Customer%20Success%20Management%3A%20Helping%20Business%20Customers%20Achieve%20Their%20Goals.%20Cham%3A%20Springer%20International%20Publishing%3B%202023.%20https%3A%5C%2F%5C%2Fdoi.org%5C%2F10.1007%5C%2F978-3-031-26178-7.%26lt%3B%5C%2Fdiv%26gt%3B%5Cn%20%20%26lt%3B%5C%2Fdiv%26gt%3B%5Cn%26lt%3B%5C%2Fdiv%26gt%3B%22%2C%22data%22%3A%7B%22itemType%22%3A%22book%22%2C%22title%22%3A%22Customer%20Success%20Management%3A%20Helping%20Business%20Customers%20Achieve%20Their%20Goals%22%2C%22creators%22%3A%5B%7B%22creatorType%22%3A%22author%22%2C%22firstName%22%3A%22Michael%22%2C%22lastName%22%3A%22Kleinaltenkamp%22%7D%2C%7B%22creatorType%22%3A%22author%22%2C%22firstName%22%3A%22Katharina%22%2C%22lastName%22%3A%22Prohl-Schwenke%22%7D%2C%7B%22creatorType%22%3A%22author%22%2C%22firstName%22%3A%22Laura%22%2C%22lastName%22%3A%22Elgeti%22%7D%5D%2C%22abstractNote%22%3A%22%22%2C%22date%22%3A%222023%22%2C%22language%22%3A%22en%22%2C%22ISBN%22%3A%229783031261770%209783031261787%22%2C%22url%22%3A%22https%3A%5C%2F%5C%2Flink.springer.com%5C%2F10.1007%5C%2F978-3-031-26178-7%22%2C%22collections%22%3A%5B%22EX8X77RT%22%5D%2C%22dateModified%22%3A%222023-04-05T15%3A16%3A19Z%22%7D%7D%2C%7B%22key%22%3A%22MWUINIK6%22%2C%22library%22%3A%7B%22id%22%3A11239602%7D%2C%22meta%22%3A%7B%22creatorSummary%22%3A%22Eggert%20et%20al.%22%2C%22parsedDate%22%3A%222020%22%2C%22numChildren%22%3A0%7D%2C%22bib%22%3A%22%26lt%3Bdiv%20class%3D%26quot%3Bcsl-bib-body%26quot%3B%20style%3D%26quot%3Bline-height%3A%201.35%3B%20%26quot%3B%26gt%3B%5Cn%20%20%26lt%3Bdiv%20class%3D%26quot%3Bcsl-entry%26quot%3B%20style%3D%26quot%3Bclear%3A%20left%3B%20%26quot%3B%26gt%3B%5Cn%20%20%20%20%26lt%3Bdiv%20class%3D%26quot%3Bcsl-left-margin%26quot%3B%20style%3D%26quot%3Bfloat%3A%20left%3B%20padding-right%3A%200.5em%3B%20text-align%3A%20right%3B%20width%3A%201em%3B%26quot%3B%26gt%3B%5B1%5D%26lt%3B%5C%2Fdiv%26gt%3B%26lt%3Bdiv%20class%3D%26quot%3Bcsl-right-inline%26quot%3B%20style%3D%26quot%3Bmargin%3A%200%20.4em%200%201.5em%3B%26quot%3B%26gt%3BEggert%20A%2C%20Ulaga%20W%2C%20Gehring%20A.%20Managing%20Customer%20Success%20in%20Business%20Markets%3A%20Conceptual%20Foundation%20and%20Practical%20Application.%20SMR%202020%3B4%3A121%26%23x2013%3B32.%20%26lt%3Ba%20class%3D%26%23039%3Bzp-DOIURL%26%23039%3B%20href%3D%26%23039%3Bhttps%3A%5C%2F%5C%2Fdoi.org%5C%2F10.15358%5C%2F2511-8676-2020-2-3-121%26%23039%3B%26gt%3Bhttps%3A%5C%2F%5C%2Fdoi.org%5C%2F10.15358%5C%2F2511-8676-2020-2-3-121%26lt%3B%5C%2Fa%26gt%3B.%26lt%3B%5C%2Fdiv%26gt%3B%5Cn%20%20%26lt%3B%5C%2Fdiv%26gt%3B%5Cn%26lt%3B%5C%2Fdiv%26gt%3B%22%2C%22data%22%3A%7B%22itemType%22%3A%22journalArticle%22%2C%22title%22%3A%22Managing%20Customer%20Success%20in%20Business%20Markets%3A%20Conceptual%20Foundation%20and%20Practical%20Application%22%2C%22creators%22%3A%5B%7B%22creatorType%22%3A%22author%22%2C%22firstName%22%3A%22Andreas%22%2C%22lastName%22%3A%22Eggert%22%7D%2C%7B%22creatorType%22%3A%22author%22%2C%22firstName%22%3A%22Wolfgang%22%2C%22lastName%22%3A%22Ulaga%22%7D%2C%7B%22creatorType%22%3A%22author%22%2C%22firstName%22%3A%22Anna%22%2C%22lastName%22%3A%22Gehring%22%7D%5D%2C%22abstractNote%22%3A%22Customer%20success%20management%20is%20gaining%20momentum%20in%20business%20markets.%20From%20an%20initial%20focus%20on%20selected%20industries%2C%20such%20as%20software-as-a-service%2C%20interest%20in%20customer%20success%20is%20spreading%20among%20business-to-business%20marketing%20practitioners.%20To%20date%2C%20academia%20has%20largely%20neglected%20this%20concept%20and%20its%20organizational%20implementation.%20Based%20on%20extant%20managerial%20literature%20and%20research%20on%20value%20in%20use%20in%20business%20markets%2C%20we%20distinguish%20between%20customer%20success%20as%20a%20customer-perceived%20construct%2C%20customer%20success%20management%20as%20a%20joint%20customer-supplier%20management%20process%2C%20and%20the%20emerging%20job%20position%20of%20customer%20success%20managers%20in%20supplier%20organizations.%20Based%20on%20the%20case%20of%20a%20provider%20of%20IoT%20devices%2C%20software%20and%20services%20in%20decision%20agriculture%2C%20we%20illustrate%20how%20customer%20success%20management%20is%20practiced%20in%20a%20business%20marketing%20context%20and%20refine%20our%20understanding%20of%20customer%20success%20management%20and%20its%20constituents.%20Finally%2C%20we%20suggest%20promising%20avenues%20for%20future%20research%20in%20this%20managerially%20important%2C%20under-researched%20and%20rapidly%20growing%20domain.%22%2C%22date%22%3A%222020%22%2C%22language%22%3A%22%22%2C%22DOI%22%3A%2210.15358%5C%2F2511-8676-2020-2-3-121%22%2C%22ISSN%22%3A%222511-8676%22%2C%22url%22%3A%22https%3A%5C%2F%5C%2Fwww.nomos-elibrary.de%5C%2Findex.php%3Fdoi%3D10.15358%5C%2F2511-8676-2020-2-3-121%22%2C%22collections%22%3A%5B%22EX8X77RT%22%5D%2C%22dateModified%22%3A%222023-04-05T11%3A53%3A00Z%22%7D%7D%2C%7B%22key%22%3A%22ML449JFW%22%2C%22library%22%3A%7B%22id%22%3A11239602%7D%2C%22meta%22%3A%7B%22creatorSummary%22%3A%22Hilton%20et%20al.%22%2C%22parsedDate%22%3A%222020%22%2C%22numChildren%22%3A0%7D%2C%22bib%22%3A%22%26lt%3Bdiv%20class%3D%26quot%3Bcsl-bib-body%26quot%3B%20style%3D%26quot%3Bline-height%3A%201.35%3B%20%26quot%3B%26gt%3B%5Cn%20%20%26lt%3Bdiv%20class%3D%26quot%3Bcsl-entry%26quot%3B%20style%3D%26quot%3Bclear%3A%20left%3B%20%26quot%3B%26gt%3B%5Cn%20%20%20%20%26lt%3Bdiv%20class%3D%26quot%3Bcsl-left-margin%26quot%3B%20style%3D%26quot%3Bfloat%3A%20left%3B%20padding-right%3A%200.5em%3B%20text-align%3A%20right%3B%20width%3A%201em%3B%26quot%3B%26gt%3B%5B1%5D%26lt%3B%5C%2Fdiv%26gt%3B%26lt%3Bdiv%20class%3D%26quot%3Bcsl-right-inline%26quot%3B%20style%3D%26quot%3Bmargin%3A%200%20.4em%200%201.5em%3B%26quot%3B%26gt%3BHilton%20B%2C%20Hajihashemi%20B%2C%20Henderson%20CM%2C%20Palmatier%20RW.%20Customer%20Success%20Management%3A%20The%20next%20evolution%20in%20customer%20management%20practice%3F%20Industrial%20Marketing%20Management%202020%3B90%3A360%26%23x2013%3B9.%20%26lt%3Ba%20class%3D%26%23039%3Bzp-DOIURL%26%23039%3B%20href%3D%26%23039%3Bhttps%3A%5C%2F%5C%2Fdoi.org%5C%2F10.1016%5C%2Fj.indmarman.2020.08.001%26%23039%3B%26gt%3Bhttps%3A%5C%2F%5C%2Fdoi.org%5C%2F10.1016%5C%2Fj.indmarman.2020.08.001%26lt%3B%5C%2Fa%26gt%3B.%26lt%3B%5C%2Fdiv%26gt%3B%5Cn%20%20%26lt%3B%5C%2Fdiv%26gt%3B%5Cn%26lt%3B%5C%2Fdiv%26gt%3B%22%2C%22data%22%3A%7B%22itemType%22%3A%22journalArticle%22%2C%22title%22%3A%22Customer%20Success%20Management%3A%20The%20next%20evolution%20in%20customer%20management%20practice%3F%22%2C%22creators%22%3A%5B%7B%22creatorType%22%3A%22author%22%2C%22firstName%22%3A%22Bryson%22%2C%22lastName%22%3A%22Hilton%22%7D%2C%7B%22creatorType%22%3A%22author%22%2C%22firstName%22%3A%22Bita%22%2C%22lastName%22%3A%22Hajihashemi%22%7D%2C%7B%22creatorType%22%3A%22author%22%2C%22firstName%22%3A%22Conor%20M.%22%2C%22lastName%22%3A%22Henderson%22%7D%2C%7B%22creatorType%22%3A%22author%22%2C%22firstName%22%3A%22Robert%20W.%22%2C%22lastName%22%3A%22Palmatier%22%7D%5D%2C%22abstractNote%22%3A%22%22%2C%22date%22%3A%2210%5C%2F2020%22%2C%22language%22%3A%22en%22%2C%22DOI%22%3A%2210.1016%5C%2Fj.indmarman.2020.08.001%22%2C%22ISSN%22%3A%2200198501%22%2C%22url%22%3A%22https%3A%5C%2F%5C%2Flinkinghub.elsevier.com%5C%2Fretrieve%5C%2Fpii%5C%2FS0019850120302789%22%2C%22collections%22%3A%5B%22EX8X77RT%22%5D%2C%22dateModified%22%3A%222023-04-02T15%3A09%3A09Z%22%7D%7D%2C%7B%22key%22%3A%22Q3MAE2YD%22%2C%22library%22%3A%7B%22id%22%3A11239602%7D%2C%22meta%22%3A%7B%22creatorSummary%22%3A%22Hamilton%20and%20Martin-West%22%2C%22parsedDate%22%3A%222019-10-31%22%2C%22numChildren%22%3A0%7D%2C%22bib%22%3A%22%26lt%3Bdiv%20class%3D%26quot%3Bcsl-bib-body%26quot%3B%20style%3D%26quot%3Bline-height%3A%201.35%3B%20%26quot%3B%26gt%3B%5Cn%20%20%26lt%3Bdiv%20class%3D%26quot%3Bcsl-entry%26quot%3B%20style%3D%26quot%3Bclear%3A%20left%3B%20%26quot%3B%26gt%3B%5Cn%20%20%20%20%26lt%3Bdiv%20class%3D%26quot%3Bcsl-left-margin%26quot%3B%20style%3D%26quot%3Bfloat%3A%20left%3B%20padding-right%3A%200.5em%3B%20text-align%3A%20right%3B%20width%3A%201em%3B%26quot%3B%26gt%3B%5B1%5D%26lt%3B%5C%2Fdiv%26gt%3B%26lt%3Bdiv%20class%3D%26quot%3Bcsl-right-inline%26quot%3B%20style%3D%26quot%3Bmargin%3A%200%20.4em%200%201.5em%3B%26quot%3B%26gt%3BHamilton%20L%2C%20Martin-West%20S.%20Universal%20Basic%20Income%2C%20Poverty%2C%20and%20Social%20Justice%3A%20A%20Moral%20and%20Economic%20Imperative%20for%20Social%20Workers.%20Social%20Work%202019%3B64%3A321%26%23x2013%3B8.%20%26lt%3Ba%20class%3D%26%23039%3Bzp-DOIURL%26%23039%3B%20href%3D%26%23039%3Bhttps%3A%5C%2F%5C%2Fdoi.org%5C%2F10.1093%5C%2Fsw%5C%2Fswz028%26%23039%3B%26gt%3Bhttps%3A%5C%2F%5C%2Fdoi.org%5C%2F10.1093%5C%2Fsw%5C%2Fswz028%26lt%3B%5C%2Fa%26gt%3B.%26lt%3B%5C%2Fdiv%26gt%3B%5Cn%20%20%26lt%3B%5C%2Fdiv%26gt%3B%5Cn%26lt%3B%5C%2Fdiv%26gt%3B%22%2C%22data%22%3A%7B%22itemType%22%3A%22journalArticle%22%2C%22title%22%3A%22Universal%20Basic%20Income%2C%20Poverty%2C%20and%20Social%20Justice%3A%20A%20Moral%20and%20Economic%20Imperative%20for%20Social%20Workers%22%2C%22creators%22%3A%5B%7B%22creatorType%22%3A%22author%22%2C%22firstName%22%3A%22Leah%22%2C%22lastName%22%3A%22Hamilton%22%7D%2C%7B%22creatorType%22%3A%22author%22%2C%22firstName%22%3A%22Stacia%22%2C%22lastName%22%3A%22Martin-West%22%7D%5D%2C%22abstractNote%22%3A%22Abstract%20%5Cn%20%20%20%20%20%20%20%20%20%20%20%20Modern%20technology%20threatens%20to%20dramatically%20alter%20the%20U.S.%20labor%20economy%2C%20but%20the%20crumbling%20social%20safety%20net%20may%20be%20insufficient%20for%20affected%20workers.%20Some%20advocates%20propose%20to%20address%20these%20converging%20problems%20through%20universal%20basic%20income%20%28UBI%29.%20Authors%20conducted%20a%20preliminary%20review%20of%20social%20work%20perspectives%20on%20the%20topic%20of%20UBI.%20They%20found%20very%20little%20relevant%20literature%2C%20especially%20among%20American%20scholars.%20Existent%20social%20work%20literature%20frames%20UBI%20as%20an%20alternative%20to%20the%20neoliberal%20welfare%20state%20and%20mass%20unemployment.%20Social%20workers%20also%20contribute%20a%20critical%20social%20justice%20orientation%20to%20UBI%20scholarship%20in%20other%20disciplines.%20Grounded%20in%20the%20NASW%20Code%20of%20Ethics%2C%20authors%20argue%20that%20it%20is%20imperative%20for%20American%20social%20workers%20to%20seriously%20consider%20UBI%20as%20an%20answer%20to%20growing%20inequality%20and%20the%20unique%20expertise%20that%20social%20workers%20offer%20as%20allies%20of%20marginalized%20populations.%22%2C%22date%22%3A%222019-10-31%22%2C%22language%22%3A%22en%22%2C%22DOI%22%3A%2210.1093%5C%2Fsw%5C%2Fswz028%22%2C%22ISSN%22%3A%220037-8046%2C%201545-6846%22%2C%22url%22%3A%22https%3A%5C%2F%5C%2Facademic.oup.com%5C%2Fsw%5C%2Farticle%5C%2F64%5C%2F4%5C%2F321%5C%2F5576193%22%2C%22collections%22%3A%5B%225FKAUV6X%22%5D%2C%22dateModified%22%3A%222023-03-19T08%3A11%3A16Z%22%7D%7D%2C%7B%22key%22%3A%22THACZ7BH%22%2C%22library%22%3A%7B%22id%22%3A11239602%7D%2C%22meta%22%3A%7B%22creatorSummary%22%3A%22Cristea%22%2C%22parsedDate%22%3A%222020-04-10%22%2C%22numChildren%22%3A0%7D%2C%22bib%22%3A%22%26lt%3Bdiv%20class%3D%26quot%3Bcsl-bib-body%26quot%3B%20style%3D%26quot%3Bline-height%3A%201.35%3B%20%26quot%3B%26gt%3B%5Cn%20%20%26lt%3Bdiv%20class%3D%26quot%3Bcsl-entry%26quot%3B%20style%3D%26quot%3Bclear%3A%20left%3B%20%26quot%3B%26gt%3B%5Cn%20%20%20%20%26lt%3Bdiv%20class%3D%26quot%3Bcsl-left-margin%26quot%3B%20style%3D%26quot%3Bfloat%3A%20left%3B%20padding-right%3A%200.5em%3B%20text-align%3A%20right%3B%20width%3A%201em%3B%26quot%3B%26gt%3B%5B1%5D%26lt%3B%5C%2Fdiv%26gt%3B%26lt%3Bdiv%20class%3D%26quot%3Bcsl-right-inline%26quot%3B%20style%3D%26quot%3Bmargin%3A%200%20.4em%200%201.5em%3B%26quot%3B%26gt%3BCristea%20M-A.%20Why%20a%20Quality%20Website%20is%20Essential%20to%20Your%20Business.%20Business%20Review%202020.%20%26lt%3Ba%20class%3D%26%23039%3Bzp-ItemURL%26%23039%3B%20href%3D%26%23039%3Bhttps%3A%5C%2F%5C%2Fbusiness-review.eu%5C%2Ftech%5C%2Fonline%5C%2Fwhy-a-quality-website-is-essential-to-your-business-209457%26%23039%3B%26gt%3Bhttps%3A%5C%2F%5C%2Fbusiness-review.eu%5C%2Ftech%5C%2Fonline%5C%2Fwhy-a-quality-website-is-essential-to-your-business-209457%26lt%3B%5C%2Fa%26gt%3B%20%28accessed%20March%2018%2C%202023%29.%26lt%3B%5C%2Fdiv%26gt%3B%5Cn%20%20%26lt%3B%5C%2Fdiv%26gt%3B%5Cn%26lt%3B%5C%2Fdiv%26gt%3B%22%2C%22data%22%3A%7B%22itemType%22%3A%22blogPost%22%2C%22title%22%3A%22Why%20a%20Quality%20Website%20is%20Essential%20to%20Your%20Business%22%2C%22creators%22%3A%5B%7B%22creatorType%22%3A%22author%22%2C%22firstName%22%3A%22Mihai-Alexandru%22%2C%22lastName%22%3A%22Cristea%22%7D%5D%2C%22abstractNote%22%3A%22Online%20-%20In%20today%5Cu2019s%20world%2C%20the%20majority%20of%20people%20use%20the%20internet%20for%20several%20things.%20Do%20you%20need%20an%20air%20conditioner%20cleaner%3F%20Looking%20for%20food%20delivery%3F%20Review%22%2C%22blogTitle%22%3A%22Business%20Review%22%2C%22date%22%3A%222020-04-10T12%3A39%3A51%2B00%3A00%22%2C%22url%22%3A%22https%3A%5C%2F%5C%2Fbusiness-review.eu%5C%2Ftech%5C%2Fonline%5C%2Fwhy-a-quality-website-is-essential-to-your-business-209457%22%2C%22language%22%3A%22ro%22%2C%22collections%22%3A%5B%22IMP5CR4T%22%5D%2C%22dateModified%22%3A%222023-03-18T08%3A26%3A13Z%22%7D%7D%2C%7B%22key%22%3A%22E5J644GR%22%2C%22library%22%3A%7B%22id%22%3A11239602%7D%2C%22meta%22%3A%7B%22creatorSummary%22%3A%22Cunningham%22%2C%22parsedDate%22%3A%222022-09-13%22%2C%22numChildren%22%3A0%7D%2C%22bib%22%3A%22%26lt%3Bdiv%20class%3D%26quot%3Bcsl-bib-body%26quot%3B%20style%3D%26quot%3Bline-height%3A%201.35%3B%20%26quot%3B%26gt%3B%5Cn%20%20%26lt%3Bdiv%20class%3D%26quot%3Bcsl-entry%26quot%3B%20style%3D%26quot%3Bclear%3A%20left%3B%20%26quot%3B%26gt%3B%5Cn%20%20%20%20%26lt%3Bdiv%20class%3D%26quot%3Bcsl-left-margin%26quot%3B%20style%3D%26quot%3Bfloat%3A%20left%3B%20padding-right%3A%200.5em%3B%20text-align%3A%20right%3B%20width%3A%201em%3B%26quot%3B%26gt%3B%5B1%5D%26lt%3B%5C%2Fdiv%26gt%3B%26lt%3Bdiv%20class%3D%26quot%3Bcsl-right-inline%26quot%3B%20style%3D%26quot%3Bmargin%3A%200%20.4em%200%201.5em%3B%26quot%3B%26gt%3BCunningham%20C.%2010%20tips%20to%20improve%20the%20quality%20of%20your%20page.%20Yoast%202022.%20%26lt%3Ba%20class%3D%26%23039%3Bzp-ItemURL%26%23039%3B%20href%3D%26%23039%3Bhttps%3A%5C%2F%5C%2Fyoast.com%5C%2Foptimize-low-quality-page%5C%2F%26%23039%3B%26gt%3Bhttps%3A%5C%2F%5C%2Fyoast.com%5C%2Foptimize-low-quality-page%5C%2F%26lt%3B%5C%2Fa%26gt%3B%20%28accessed%20March%2017%2C%202023%29.%26lt%3B%5C%2Fdiv%26gt%3B%5Cn%20%20%26lt%3B%5C%2Fdiv%26gt%3B%5Cn%26lt%3B%5C%2Fdiv%26gt%3B%22%2C%22data%22%3A%7B%22itemType%22%3A%22webpage%22%2C%22title%22%3A%2210%20tips%20to%20improve%20the%20quality%20of%20your%20page%22%2C%22creators%22%3A%5B%7B%22creatorType%22%3A%22author%22%2C%22firstName%22%3A%22Camille%22%2C%22lastName%22%3A%22Cunningham%22%7D%5D%2C%22abstractNote%22%3A%22Looking%20to%20improve%20the%20quality%20of%20your%20page%3F%20We%26%23039%3Bll%20discuss%20how%20to%20determine%20which%20pages%20you%20need%20to%20work%20on%20and%20what%20you%20can%20do%21%22%2C%22date%22%3A%222022-09-13T13%3A45%3A00%2B00%3A00%22%2C%22url%22%3A%22https%3A%5C%2F%5C%2Fyoast.com%5C%2Foptimize-low-quality-page%5C%2F%22%2C%22language%22%3A%22en%22%2C%22collections%22%3A%5B%22IMP5CR4T%22%5D%2C%22dateModified%22%3A%222023-03-17T16%3A04%3A35Z%22%7D%7D%2C%7B%22key%22%3A%22HVNMZTEB%22%2C%22library%22%3A%7B%22id%22%3A11239602%7D%2C%22meta%22%3A%7B%22creatorSummary%22%3A%22Rizvanovi%5Cu0107%20et%20al.%22%2C%22parsedDate%22%3A%222023%22%2C%22numChildren%22%3A0%7D%2C%22bib%22%3A%22%26lt%3Bdiv%20class%3D%26quot%3Bcsl-bib-body%26quot%3B%20style%3D%26quot%3Bline-height%3A%201.35%3B%20%26quot%3B%26gt%3B%5Cn%20%20%26lt%3Bdiv%20class%3D%26quot%3Bcsl-entry%26quot%3B%20style%3D%26quot%3Bclear%3A%20left%3B%20%26quot%3B%26gt%3B%5Cn%20%20%20%20%26lt%3Bdiv%20class%3D%26quot%3Bcsl-left-margin%26quot%3B%20style%3D%26quot%3Bfloat%3A%20left%3B%20padding-right%3A%200.5em%3B%20text-align%3A%20right%3B%20width%3A%201em%3B%26quot%3B%26gt%3B%5B1%5D%26lt%3B%5C%2Fdiv%26gt%3B%26lt%3Bdiv%20class%3D%26quot%3Bcsl-right-inline%26quot%3B%20style%3D%26quot%3Bmargin%3A%200%20.4em%200%201.5em%3B%26quot%3B%26gt%3BRizvanovi%26%23x107%3B%20B%2C%20Zutshi%20A%2C%20Grilo%20A%2C%20Nodehi%20T.%20Linking%20the%20potentials%20of%20extended%20digital%20marketing%20impact%20and%20start-up%20growth%3A%20Developing%20a%20macro-dynamic%20framework%20of%20start-up%20growth%20drivers%20supported%20by%20digital%20marketing.%20Technological%20Forecasting%20and%20Social%20Change%202023%3B186%3A122128.%20%26lt%3Ba%20class%3D%26%23039%3Bzp-DOIURL%26%23039%3B%20href%3D%26%23039%3Bhttps%3A%5C%2F%5C%2Fdoi.org%5C%2F10.1016%5C%2Fj.techfore.2022.122128%26%23039%3B%26gt%3Bhttps%3A%5C%2F%5C%2Fdoi.org%5C%2F10.1016%5C%2Fj.techfore.2022.122128%26lt%3B%5C%2Fa%26gt%3B.%26lt%3B%5C%2Fdiv%26gt%3B%5Cn%20%20%26lt%3B%5C%2Fdiv%26gt%3B%5Cn%26lt%3B%5C%2Fdiv%26gt%3B%22%2C%22data%22%3A%7B%22itemType%22%3A%22journalArticle%22%2C%22title%22%3A%22Linking%20the%20potentials%20of%20extended%20digital%20marketing%20impact%20and%20start-up%20growth%3A%20Developing%20a%20macro-dynamic%20framework%20of%20start-up%20growth%20drivers%20supported%20by%20digital%20marketing%22%2C%22creators%22%3A%5B%7B%22creatorType%22%3A%22author%22%2C%22firstName%22%3A%22Belma%22%2C%22lastName%22%3A%22Rizvanovi%5Cu0107%22%7D%2C%7B%22creatorType%22%3A%22author%22%2C%22firstName%22%3A%22Aneesh%22%2C%22lastName%22%3A%22Zutshi%22%7D%2C%7B%22creatorType%22%3A%22author%22%2C%22firstName%22%3A%22Antonio%22%2C%22lastName%22%3A%22Grilo%22%7D%2C%7B%22creatorType%22%3A%22author%22%2C%22firstName%22%3A%22Tahereh%22%2C%22lastName%22%3A%22Nodehi%22%7D%5D%2C%22abstractNote%22%3A%22%22%2C%22date%22%3A%2201%5C%2F2023%22%2C%22language%22%3A%22en%22%2C%22DOI%22%3A%2210.1016%5C%2Fj.techfore.2022.122128%22%2C%22ISSN%22%3A%2200401625%22%2C%22url%22%3A%22https%3A%5C%2F%5C%2Flinkinghub.elsevier.com%5C%2Fretrieve%5C%2Fpii%5C%2FS0040162522006497%22%2C%22collections%22%3A%5B%22WFXU5FRZ%22%5D%2C%22dateModified%22%3A%222023-03-16T17%3A24%3A58Z%22%7D%7D%2C%7B%22key%22%3A%22PWL6R9CM%22%2C%22library%22%3A%7B%22id%22%3A11239602%7D%2C%22meta%22%3A%7B%22creatorSummary%22%3A%22Tondani%22%2C%22parsedDate%22%3A%222009%22%2C%22numChildren%22%3A0%7D%2C%22bib%22%3A%22%26lt%3Bdiv%20class%3D%26quot%3Bcsl-bib-body%26quot%3B%20style%3D%26quot%3Bline-height%3A%201.35%3B%20%26quot%3B%26gt%3B%5Cn%20%20%26lt%3Bdiv%20class%3D%26quot%3Bcsl-entry%26quot%3B%20style%3D%26quot%3Bclear%3A%20left%3B%20%26quot%3B%26gt%3B%5Cn%20%20%20%20%26lt%3Bdiv%20class%3D%26quot%3Bcsl-left-margin%26quot%3B%20style%3D%26quot%3Bfloat%3A%20left%3B%20padding-right%3A%200.5em%3B%20text-align%3A%20right%3B%20width%3A%201em%3B%26quot%3B%26gt%3B%5B1%5D%26lt%3B%5C%2Fdiv%26gt%3B%26lt%3Bdiv%20class%3D%26quot%3Bcsl-right-inline%26quot%3B%20style%3D%26quot%3Bmargin%3A%200%20.4em%200%201.5em%3B%26quot%3B%26gt%3BTondani%20D.%20Universal%20Basic%20Income%20and%20Negative%20Income%20Tax%3A%20Two%20different%20ways%20of%20thinking%20redistribution.%20The%20Journal%20of%20Socio-Economics%202009%3B38%3A246%26%23x2013%3B55.%20%26lt%3Ba%20class%3D%26%23039%3Bzp-DOIURL%26%23039%3B%20href%3D%26%23039%3Bhttps%3A%5C%2F%5C%2Fdoi.org%5C%2F10.1016%5C%2Fj.socec.2008.10.006%26%23039%3B%26gt%3Bhttps%3A%5C%2F%5C%2Fdoi.org%5C%2F10.1016%5C%2Fj.socec.2008.10.006%26lt%3B%5C%2Fa%26gt%3B.%26lt%3B%5C%2Fdiv%26gt%3B%5Cn%20%20%26lt%3B%5C%2Fdiv%26gt%3B%5Cn%26lt%3B%5C%2Fdiv%26gt%3B%22%2C%22data%22%3A%7B%22itemType%22%3A%22journalArticle%22%2C%22title%22%3A%22Universal%20Basic%20Income%20and%20Negative%20Income%20Tax%3A%20Two%20different%20ways%20of%20thinking%20redistribution%22%2C%22creators%22%3A%5B%7B%22creatorType%22%3A%22author%22%2C%22firstName%22%3A%22Davide%22%2C%22lastName%22%3A%22Tondani%22%7D%5D%2C%22abstractNote%22%3A%22%22%2C%22date%22%3A%223%5C%2F2009%22%2C%22language%22%3A%22en%22%2C%22DOI%22%3A%2210.1016%5C%2Fj.socec.2008.10.006%22%2C%22ISSN%22%3A%2210535357%22%2C%22url%22%3A%22https%3A%5C%2F%5C%2Flinkinghub.elsevier.com%5C%2Fretrieve%5C%2Fpii%5C%2FS1053535708001832%22%2C%22collections%22%3A%5B%225FKAUV6X%22%5D%2C%22dateModified%22%3A%222023-03-15T19%3A01%3A17Z%22%7D%7D%2C%7B%22key%22%3A%22VWHHAA8H%22%2C%22library%22%3A%7B%22id%22%3A11239602%7D%2C%22meta%22%3A%7B%22creatorSummary%22%3A%22Giardino%20et%20al.%22%2C%22parsedDate%22%3A%222014%22%2C%22numChildren%22%3A0%7D%2C%22bib%22%3A%22%26lt%3Bdiv%20class%3D%26quot%3Bcsl-bib-body%26quot%3B%20style%3D%26quot%3Bline-height%3A%201.35%3B%20%26quot%3B%26gt%3B%5Cn%20%20%26lt%3Bdiv%20class%3D%26quot%3Bcsl-entry%26quot%3B%20style%3D%26quot%3Bclear%3A%20left%3B%20%26quot%3B%26gt%3B%5Cn%20%20%20%20%26lt%3Bdiv%20class%3D%26quot%3Bcsl-left-margin%26quot%3B%20style%3D%26quot%3Bfloat%3A%20left%3B%20padding-right%3A%200.5em%3B%20text-align%3A%20right%3B%20width%3A%201em%3B%26quot%3B%26gt%3B%5B1%5D%26lt%3B%5C%2Fdiv%26gt%3B%26lt%3Bdiv%20class%3D%26quot%3Bcsl-right-inline%26quot%3B%20style%3D%26quot%3Bmargin%3A%200%20.4em%200%201.5em%3B%26quot%3B%26gt%3BGiardino%20C%2C%20Wang%20X%2C%20Abrahamsson%20P.%20Why%20Early-Stage%20Software%20Startups%20Fail%3A%20A%20Behavioral%20Framework.%20In%3A%20Lassenius%20C%2C%20Smolander%20K%2C%20editors.%20Software%20Business.%20Towards%20Continuous%20Value%20Delivery%2C%20vol.%20182%2C%20Cham%3A%20Springer%20International%20Publishing%3B%202014%2C%20p.%2027%26%23x2013%3B41.%20https%3A%5C%2F%5C%2Fdoi.org%5C%2F10.1007%5C%2F978-3-319-08738-2_3.%26lt%3B%5C%2Fdiv%26gt%3B%5Cn%20%20%26lt%3B%5C%2Fdiv%26gt%3B%5Cn%26lt%3B%5C%2Fdiv%26gt%3B%22%2C%22data%22%3A%7B%22itemType%22%3A%22bookSection%22%2C%22title%22%3A%22Why%20Early-Stage%20Software%20Startups%20Fail%3A%20A%20Behavioral%20Framework%22%2C%22creators%22%3A%5B%7B%22creatorType%22%3A%22seriesEditor%22%2C%22firstName%22%3A%22Wil%22%2C%22lastName%22%3A%22Van%20Der%20Aalst%22%7D%2C%7B%22creatorType%22%3A%22seriesEditor%22%2C%22firstName%22%3A%22John%22%2C%22lastName%22%3A%22Mylopoulos%22%7D%2C%7B%22creatorType%22%3A%22seriesEditor%22%2C%22firstName%22%3A%22Michael%22%2C%22lastName%22%3A%22Rosemann%22%7D%2C%7B%22creatorType%22%3A%22seriesEditor%22%2C%22firstName%22%3A%22Michael%20J.%22%2C%22lastName%22%3A%22Shaw%22%7D%2C%7B%22creatorType%22%3A%22seriesEditor%22%2C%22firstName%22%3A%22Clemens%22%2C%22lastName%22%3A%22Szyperski%22%7D%2C%7B%22creatorType%22%3A%22editor%22%2C%22firstName%22%3A%22Casper%22%2C%22lastName%22%3A%22Lassenius%22%7D%2C%7B%22creatorType%22%3A%22editor%22%2C%22firstName%22%3A%22Kari%22%2C%22lastName%22%3A%22Smolander%22%7D%2C%7B%22creatorType%22%3A%22author%22%2C%22firstName%22%3A%22Carmine%22%2C%22lastName%22%3A%22Giardino%22%7D%2C%7B%22creatorType%22%3A%22author%22%2C%22firstName%22%3A%22Xiaofeng%22%2C%22lastName%22%3A%22Wang%22%7D%2C%7B%22creatorType%22%3A%22author%22%2C%22firstName%22%3A%22Pekka%22%2C%22lastName%22%3A%22Abrahamsson%22%7D%5D%2C%22abstractNote%22%3A%22%22%2C%22bookTitle%22%3A%22Software%20Business.%20Towards%20Continuous%20Value%20Delivery%22%2C%22date%22%3A%222014%22%2C%22language%22%3A%22en%22%2C%22ISBN%22%3A%229783319087375%209783319087382%22%2C%22url%22%3A%22http%3A%5C%2F%5C%2Flink.springer.com%5C%2F10.1007%5C%2F978-3-319-08738-2_3%22%2C%22collections%22%3A%5B%22WFXU5FRZ%22%5D%2C%22dateModified%22%3A%222023-03-15T10%3A09%3A19Z%22%7D%7D%2C%7B%22key%22%3A%22ATCTITDD%22%2C%22library%22%3A%7B%22id%22%3A11239602%7D%2C%22meta%22%3A%7B%22creatorSummary%22%3A%22Ferrazzi%20and%20Raz%22%2C%22parsedDate%22%3A%222014%22%2C%22numChildren%22%3A0%7D%2C%22bib%22%3A%22%26lt%3Bdiv%20class%3D%26quot%3Bcsl-bib-body%26quot%3B%20style%3D%26quot%3Bline-height%3A%201.35%3B%20%26quot%3B%26gt%3B%5Cn%20%20%26lt%3Bdiv%20class%3D%26quot%3Bcsl-entry%26quot%3B%20style%3D%26quot%3Bclear%3A%20left%3B%20%26quot%3B%26gt%3B%5Cn%20%20%20%20%26lt%3Bdiv%20class%3D%26quot%3Bcsl-left-margin%26quot%3B%20style%3D%26quot%3Bfloat%3A%20left%3B%20padding-right%3A%200.5em%3B%20text-align%3A%20right%3B%20width%3A%201em%3B%26quot%3B%26gt%3B%5B1%5D%26lt%3B%5C%2Fdiv%26gt%3B%26lt%3Bdiv%20class%3D%26quot%3Bcsl-right-inline%26quot%3B%20style%3D%26quot%3Bmargin%3A%200%20.4em%200%201.5em%3B%26quot%3B%26gt%3BFerrazzi%20K%2C%20Raz%20T.%20Never%20eat%20alone%3A%20and%20other%20secrets%20to%20success%2C%20one%20relationship%20at%20a%20time.%20Expanded%20and%20updated%20%5Bedition%5D.%20New%20York%3A%20Crown%20Business%3B%202014.%26lt%3B%5C%2Fdiv%26gt%3B%5Cn%20%20%26lt%3B%5C%2Fdiv%26gt%3B%5Cn%26lt%3B%5C%2Fdiv%26gt%3B%22%2C%22data%22%3A%7B%22itemType%22%3A%22book%22%2C%22title%22%3A%22Never%20eat%20alone%3A%20and%20other%20secrets%20to%20success%2C%20one%20relationship%20at%20a%20time%22%2C%22creators%22%3A%5B%7B%22creatorType%22%3A%22author%22%2C%22firstName%22%3A%22Keith%22%2C%22lastName%22%3A%22Ferrazzi%22%7D%2C%7B%22creatorType%22%3A%22author%22%2C%22firstName%22%3A%22Tahl%22%2C%22lastName%22%3A%22Raz%22%7D%5D%2C%22abstractNote%22%3A%22%22%2C%22date%22%3A%222014%22%2C%22language%22%3A%22%22%2C%22ISBN%22%3A%229780385346658%209780553418767%22%2C%22url%22%3A%22%22%2C%22collections%22%3A%5B%229FFPS293%22%5D%2C%22dateModified%22%3A%222023-03-14T12%3A28%3A46Z%22%7D%7D%2C%7B%22key%22%3A%22G4DW7M77%22%2C%22library%22%3A%7B%22id%22%3A11239602%7D%2C%22meta%22%3A%7B%22creatorSummary%22%3A%22Ivory%20and%20Hearst%22%2C%22parsedDate%22%3A%222002-03%22%2C%22numChildren%22%3A0%7D%2C%22bib%22%3A%22%26lt%3Bdiv%20class%3D%26quot%3Bcsl-bib-body%26quot%3B%20style%3D%26quot%3Bline-height%3A%201.35%3B%20%26quot%3B%26gt%3B%5Cn%20%20%26lt%3Bdiv%20class%3D%26quot%3Bcsl-entry%26quot%3B%20style%3D%26quot%3Bclear%3A%20left%3B%20%26quot%3B%26gt%3B%5Cn%20%20%20%20%26lt%3Bdiv%20class%3D%26quot%3Bcsl-left-margin%26quot%3B%20style%3D%26quot%3Bfloat%3A%20left%3B%20padding-right%3A%200.5em%3B%20text-align%3A%20right%3B%20width%3A%201em%3B%26quot%3B%26gt%3B%5B1%5D%26lt%3B%5C%2Fdiv%26gt%3B%26lt%3Bdiv%20class%3D%26quot%3Bcsl-right-inline%26quot%3B%20style%3D%26quot%3Bmargin%3A%200%20.4em%200%201.5em%3B%26quot%3B%26gt%3BIvory%20MY%2C%20Hearst%20MA.%20Improving%20Web%20site%20design.%20IEEE%20Internet%20Computing%202002%3B6%3A56%26%23x2013%3B63.%20%26lt%3Ba%20class%3D%26%23039%3Bzp-DOIURL%26%23039%3B%20href%3D%26%23039%3Bhttps%3A%5C%2F%5C%2Fdoi.org%5C%2F10.1109%5C%2F4236.991444%26%23039%3B%26gt%3Bhttps%3A%5C%2F%5C%2Fdoi.org%5C%2F10.1109%5C%2F4236.991444%26lt%3B%5C%2Fa%26gt%3B.%26lt%3B%5C%2Fdiv%26gt%3B%5Cn%20%20%26lt%3B%5C%2Fdiv%26gt%3B%5Cn%26lt%3B%5C%2Fdiv%26gt%3B%22%2C%22data%22%3A%7B%22itemType%22%3A%22journalArticle%22%2C%22title%22%3A%22Improving%20Web%20site%20design%22%2C%22creators%22%3A%5B%7B%22creatorType%22%3A%22author%22%2C%22firstName%22%3A%22M.Y.%22%2C%22lastName%22%3A%22Ivory%22%7D%2C%7B%22creatorType%22%3A%22author%22%2C%22firstName%22%3A%22M.A.%22%2C%22lastName%22%3A%22Hearst%22%7D%5D%2C%22abstractNote%22%3A%22Using%20quantitative%20measures%20of%20the%20informational%2C%20navigational%2C%20and%20graphical%20aspects%20of%20a%20Web%20site%2C%20a%20quality%20checker%20aims%20to%20help%20nonprofessional%20designers%20improve%20their%20Web%20sites.%20As%20part%20of%20the%20WebTango%20project%2C%20we%20explore%20automated%20approaches%20for%20helping%20designers%20improve%20their%20sites.%20Our%20goal%20is%20to%20create%20an%20interactive%20tool%20that%20helps%20steer%20occasional%20Web%20site%20builders%20away%20from%20bad%20designs%20and%20toward%20better%20ones%20-%20a%20%26quot%3Bquality%20checker%26quot%3B%20tool%2C%20analogous%20to%20a%20grammar%20checker%20in%20a%20word%20processor.%20What%20distinguishes%20our%20work%20from%20most%20others%20is%20that%20this%20tool%20is%20based%20on%20empirically%20derived%20measures%20computed%20over%20thousands%20of%20Web%20pages.%20We%20converted%20these%20measures%2C%20which%20characterize%20the%20informational%2C%20navigational%2C%20and%20graphical%20aspects%20of%20a%20Web%20site%2C%20into%20profiles%20for%20a%20variety%20of%20site%20types.%20Our%20rudimentary%20design-checking%20tool%20uses%20these%20profiles%20to%20assess%20Web%20site%20designs%3B%20future%20versions%20will%20also%20suggest%20design%20improvements.%22%2C%22date%22%3A%222002-03%22%2C%22language%22%3A%22%22%2C%22DOI%22%3A%2210.1109%5C%2F4236.991444%22%2C%22ISSN%22%3A%221941-0131%22%2C%22url%22%3A%22%22%2C%22collections%22%3A%5B%22IMP5CR4T%22%5D%2C%22dateModified%22%3A%222023-03-14T08%3A58%3A42Z%22%7D%7D%2C%7B%22key%22%3A%227DPMURN4%22%2C%22library%22%3A%7B%22id%22%3A11239602%7D%2C%22meta%22%3A%7B%22creatorSummary%22%3A%22Rohrer%20et%20al.%22%2C%22parsedDate%22%3A%222011-01-01%22%2C%22numChildren%22%3A0%7D%2C%22bib%22%3A%22%26lt%3Bdiv%20class%3D%26quot%3Bcsl-bib-body%26quot%3B%20style%3D%26quot%3Bline-height%3A%201.35%3B%20%26quot%3B%26gt%3B%5Cn%20%20%26lt%3Bdiv%20class%3D%26quot%3Bcsl-entry%26quot%3B%20style%3D%26quot%3Bclear%3A%20left%3B%20%26quot%3B%26gt%3B%5Cn%20%20%20%20%26lt%3Bdiv%20class%3D%26quot%3Bcsl-left-margin%26quot%3B%20style%3D%26quot%3Bfloat%3A%20left%3B%20padding-right%3A%200.5em%3B%20text-align%3A%20right%3B%20width%3A%201em%3B%26quot%3B%26gt%3B%5B1%5D%26lt%3B%5C%2Fdiv%26gt%3B%26lt%3Bdiv%20class%3D%26quot%3Bcsl-right-inline%26quot%3B%20style%3D%26quot%3Bmargin%3A%200%20.4em%200%201.5em%3B%26quot%3B%26gt%3BRohrer%20E%2C%20Motz%20R%2C%20Diaz%20A.%20Modelling%20a%20web%20site%20quality%26%23x2010%3Bbased%20recommendation%20system.%20International%20Journal%20of%20Web%20Information%20Systems%202011%3B7%3A396%26%23x2013%3B420.%20%26lt%3Ba%20class%3D%26%23039%3Bzp-ItemURL%26%23039%3B%20href%3D%26%23039%3Bhttps%3A%5C%2F%5C%2Fdoi.org%5C%2F10.1108%5C%2F17440081111187574%26%23039%3B%26gt%3Bhttps%3A%5C%2F%5C%2Fdoi.org%5C%2F10.1108%5C%2F17440081111187574%26lt%3B%5C%2Fa%26gt%3B.%26lt%3B%5C%2Fdiv%26gt%3B%5Cn%20%20%26lt%3B%5C%2Fdiv%26gt%3B%5Cn%26lt%3B%5C%2Fdiv%26gt%3B%22%2C%22data%22%3A%7B%22itemType%22%3A%22journalArticle%22%2C%22title%22%3A%22Modelling%20a%20web%20site%20quality%5Cu2010based%20recommendation%20system%22%2C%22creators%22%3A%5B%7B%22creatorType%22%3A%22author%22%2C%22firstName%22%3A%22Edelweis%22%2C%22lastName%22%3A%22Rohrer%22%7D%2C%7B%22creatorType%22%3A%22author%22%2C%22firstName%22%3A%22Regina%22%2C%22lastName%22%3A%22Motz%22%7D%2C%7B%22creatorType%22%3A%22author%22%2C%22firstName%22%3A%22Alicia%22%2C%22lastName%22%3A%22Diaz%22%7D%5D%2C%22abstractNote%22%3A%22Purpose%20%5Cu2013%20Web%20site%20recommendation%20systems%20help%20to%20get%20high%20quality%20information.%20The%20modelling%20of%20recommendation%20systems%20involves%20the%20combination%20of%20many%20features%3A%20metrics%20of%20quality%2C%20quality%20criteria%2C%20recommendation%20criteria%2C%20user%20profile%2C%20and%20specific%20domain%20concepts%2C%20among%20others.%20At%20the%20moment%20of%20the%20specification%20of%20a%20recommendation%20system%20it%20must%20be%20guaranteed%20a%20right%20interrelation%20of%20all%20of%20these%20features.%20The%20purpose%20of%20this%20paper%20is%20to%20model%20a%20web%20site%20quality%5Cu2010based%20recommendation%20system%20by%20an%20ontology%20network.%20Design%5C%2Fmethodology%5C%2Fapproach%20%5Cu2013%20In%20this%20paper%2C%20the%20authors%20propose%20an%20ontology%20network%20based%20process%20for%20web%20site%20recommendation%20modelling.%20The%20ontology%20network%20conceptualizes%20the%20different%20domains%20%28web%20site%20domain%2C%20quality%20assurance%20domain%2C%20user%20context%20domain%2C%20recommendation%20criteria%20domain%2C%20specific%20domain%29%20in%20a%20set%20of%20interrelated%20ontologies.%20Particularly%2C%20this%20approach%20is%20illustrated%20for%20the%20health%20domain.%20Findings%20%5Cu2013%20Basically%2C%20this%20work%20introduces%20the%20semantic%20relationships%20that%20were%20used%20to%20construct%20this%20ontology%20network.%20Moreover%2C%20it%20shows%20the%20usefulness%20of%20this%20ontology%20network%20for%20the%20detection%20of%20possible%20inconsistencies%20when%20specifying%20recommendation%20criteria.%20Originality%5C%2Fvalue%20%5Cu2013%20Recommendation%20systems%20based%20on%20ontologies%20that%20model%20the%20user%20profile%20and%20the%20domain%20of%20resources%20to%20be%20recommended%20are%20quite%20common.%20However%2C%20it%20is%20uncommon%20to%20find%20models%20that%20explicitly%20represent%20the%20criteria%20used%20by%20the%20recommender%20systems%2C%20that%20express%20the%20quality%20dimensions%20of%20resources%20and%20on%20which%20criteria%20are%20applied%2C%20and%20consider%20the%20user%20context%20at%20the%20moment%20of%20the%20query.%22%2C%22date%22%3A%222011-01-01%22%2C%22language%22%3A%22%22%2C%22DOI%22%3A%2210.1108%5C%2F17440081111187574%22%2C%22ISSN%22%3A%221744-0084%22%2C%22url%22%3A%22https%3A%5C%2F%5C%2Fdoi.org%5C%2F10.1108%5C%2F17440081111187574%22%2C%22collections%22%3A%5B%22IMP5CR4T%22%5D%2C%22dateModified%22%3A%222023-03-13T20%3A52%3A40Z%22%7D%7D%2C%7B%22key%22%3A%22Y8XRF2PV%22%2C%22library%22%3A%7B%22id%22%3A11239602%7D%2C%22meta%22%3A%7B%22creatorSummary%22%3A%22Smil%22%2C%22parsedDate%22%3A%222006%22%2C%22numChildren%22%3A0%7D%2C%22bib%22%3A%22%26lt%3Bdiv%20class%3D%26quot%3Bcsl-bib-body%26quot%3B%20style%3D%26quot%3Bline-height%3A%201.35%3B%20%26quot%3B%26gt%3B%5Cn%20%20%26lt%3Bdiv%20class%3D%26quot%3Bcsl-entry%26quot%3B%20style%3D%26quot%3Bclear%3A%20left%3B%20%26quot%3B%26gt%3B%5Cn%20%20%20%20%26lt%3Bdiv%20class%3D%26quot%3Bcsl-left-margin%26quot%3B%20style%3D%26quot%3Bfloat%3A%20left%3B%20padding-right%3A%200.5em%3B%20text-align%3A%20right%3B%20width%3A%201em%3B%26quot%3B%26gt%3B%5B1%5D%26lt%3B%5C%2Fdiv%26gt%3B%26lt%3Bdiv%20class%3D%26quot%3Bcsl-right-inline%26quot%3B%20style%3D%26quot%3Bmargin%3A%200%20.4em%200%201.5em%3B%26quot%3B%26gt%3BSmil%20V.%20Transforming%20the%20twentieth%20century%3A%20technical%20innovations%20and%20their%20consequences.%20Oxford%26%23x202F%3B%3B%20New%20York%3A%20Oxford%20University%20Press%3B%202006.%26lt%3B%5C%2Fdiv%26gt%3B%5Cn%20%20%26lt%3B%5C%2Fdiv%26gt%3B%5Cn%26lt%3B%5C%2Fdiv%26gt%3B%22%2C%22data%22%3A%7B%22itemType%22%3A%22book%22%2C%22title%22%3A%22Transforming%20the%20twentieth%20century%3A%20technical%20innovations%20and%20their%20consequences%22%2C%22creators%22%3A%5B%7B%22creatorType%22%3A%22author%22%2C%22firstName%22%3A%22Vaclav%22%2C%22lastName%22%3A%22Smil%22%7D%5D%2C%22abstractNote%22%3A%22%22%2C%22date%22%3A%222006%22%2C%22language%22%3A%22%22%2C%22ISBN%22%3A%229780195168754%22%2C%22url%22%3A%22%22%2C%22collections%22%3A%5B%229GGQIZXR%22%5D%2C%22dateModified%22%3A%222023-03-13T15%3A35%3A19Z%22%7D%7D%2C%7B%22key%22%3A%224Q9KNIUC%22%2C%22library%22%3A%7B%22id%22%3A11239602%7D%2C%22meta%22%3A%7B%22creatorSummary%22%3A%22Zhang%20and%20Cabage%22%2C%22parsedDate%22%3A%222017-04-03%22%2C%22numChildren%22%3A0%7D%2C%22bib%22%3A%22%26lt%3Bdiv%20class%3D%26quot%3Bcsl-bib-body%26quot%3B%20style%3D%26quot%3Bline-height%3A%201.35%3B%20%26quot%3B%26gt%3B%5Cn%20%20%26lt%3Bdiv%20class%3D%26quot%3Bcsl-entry%26quot%3B%20style%3D%26quot%3Bclear%3A%20left%3B%20%26quot%3B%26gt%3B%5Cn%20%20%20%20%26lt%3Bdiv%20class%3D%26quot%3Bcsl-left-margin%26quot%3B%20style%3D%26quot%3Bfloat%3A%20left%3B%20padding-right%3A%200.5em%3B%20text-align%3A%20right%3B%20width%3A%201em%3B%26quot%3B%26gt%3B%5B1%5D%26lt%3B%5C%2Fdiv%26gt%3B%26lt%3Bdiv%20class%3D%26quot%3Bcsl-right-inline%26quot%3B%20style%3D%26quot%3Bmargin%3A%200%20.4em%200%201.5em%3B%26quot%3B%26gt%3BZhang%20S%2C%20Cabage%20N.%20Search%20Engine%20Optimization%3A%20Comparison%20of%20Link%20Building%20and%20Social%20Sharing.%20Journal%20of%20Computer%20Information%20Systems%202017%3B57%3A148%26%23x2013%3B59.%20%26lt%3Ba%20class%3D%26%23039%3Bzp-ItemURL%26%23039%3B%20href%3D%26%23039%3Bhttps%3A%5C%2F%5C%2Fdoi.org%5C%2F10.1080%5C%2F08874417.2016.1183447%26%23039%3B%26gt%3Bhttps%3A%5C%2F%5C%2Fdoi.org%5C%2F10.1080%5C%2F08874417.2016.1183447%26lt%3B%5C%2Fa%26gt%3B.%26lt%3B%5C%2Fdiv%26gt%3B%5Cn%20%20%26lt%3B%5C%2Fdiv%26gt%3B%5Cn%26lt%3B%5C%2Fdiv%26gt%3B%22%2C%22data%22%3A%7B%22itemType%22%3A%22journalArticle%22%2C%22title%22%3A%22Search%20Engine%20Optimization%3A%20Comparison%20of%20Link%20Building%20and%20Social%20Sharing%22%2C%22creators%22%3A%5B%7B%22creatorType%22%3A%22author%22%2C%22firstName%22%3A%22Sonya%22%2C%22lastName%22%3A%22Zhang%22%7D%2C%7B%22creatorType%22%3A%22author%22%2C%22firstName%22%3A%22Neal%22%2C%22lastName%22%3A%22Cabage%22%7D%5D%2C%22abstractNote%22%3A%22The%20practice%20of%20Search%20Engine%20Optimization%20%28SEO%29%20can%20significantly%20increase%20a%20website%5Cu2019s%20search%20rankings%2C%20driving%20more%20traffic%20to%20the%20website%2C%20and%20thereby%20increasing%20revenue.%20Three%20primary%20SEO%20strategies%20are%20Content%2C%20Link%20Building%2C%20and%20Social%20Sharing.%20Our%20study%20compares%20the%20performance%20of%20three%20similar%20content-rich%20websites%3B%20each%20uses%20a%20different%20SEO%20strategy%20%5Cu2013%20one%20focused%20on%20Content%20only%2C%20the%20second%20uses%20Content%20and%20proactive%20Link%20Building%2C%20and%20the%20third%20uses%20Content%20and%20Social%20Media%20campaign%20designed%20to%20elicit%20social%20mentions%20and%20social%20sharing.%20We%20use%20Google%20Analytics%20to%20collect%2C%20analyze%2C%20and%20compare%20their%20site%20traffic%2C%20domain%20authority%2C%20search%20ranks%2C%20and%20ad%20revenue%20before%20and%20after%20SEO%20implementation%2C%20over%20the%20course%20of%2018%20months.%20Our%20study%20suggests%20that%20link%20building%20and%20social%20media%20both%20improve%20website%20traffic%20and%20revenue.%20Social%20media%20can%20be%20an%20effective%20method%20for%20quickly%20building%20traffic%20%28for%20events%29%3B%20however%2C%20link%20building%20provides%20better%20return%20on%20investment%20in%20the%20long%20run.%22%2C%22date%22%3A%222017-04-03%22%2C%22language%22%3A%22%22%2C%22DOI%22%3A%2210.1080%5C%2F08874417.2016.1183447%22%2C%22ISSN%22%3A%220887-4417%22%2C%22url%22%3A%22https%3A%5C%2F%5C%2Fdoi.org%5C%2F10.1080%5C%2F08874417.2016.1183447%22%2C%22collections%22%3A%5B%22W7N7TNSW%22%5D%2C%22dateModified%22%3A%222023-03-13T12%3A04%3A31Z%22%7D%7D%2C%7B%22key%22%3A%224J46I5J2%22%2C%22library%22%3A%7B%22id%22%3A11239602%7D%2C%22meta%22%3A%7B%22creatorSummary%22%3A%22Baye%20et%20al.%22%2C%22parsedDate%22%3A%222016%22%2C%22numChildren%22%3A0%7D%2C%22bib%22%3A%22%26lt%3Bdiv%20class%3D%26quot%3Bcsl-bib-body%26quot%3B%20style%3D%26quot%3Bline-height%3A%201.35%3B%20%26quot%3B%26gt%3B%5Cn%20%20%26lt%3Bdiv%20class%3D%26quot%3Bcsl-entry%26quot%3B%20style%3D%26quot%3Bclear%3A%20left%3B%20%26quot%3B%26gt%3B%5Cn%20%20%20%20%26lt%3Bdiv%20class%3D%26quot%3Bcsl-left-margin%26quot%3B%20style%3D%26quot%3Bfloat%3A%20left%3B%20padding-right%3A%200.5em%3B%20text-align%3A%20right%3B%20width%3A%201em%3B%26quot%3B%26gt%3B%5B1%5D%26lt%3B%5C%2Fdiv%26gt%3B%26lt%3Bdiv%20class%3D%26quot%3Bcsl-right-inline%26quot%3B%20style%3D%26quot%3Bmargin%3A%200%20.4em%200%201.5em%3B%26quot%3B%26gt%3BBaye%20MR%2C%20De%20Los%20Santos%20B%2C%20Wildenbeest%20MR.%20Search%20Engine%20Optimization%3A%20What%20Drives%20Organic%20Traffic%20to%20Retail%20Sites%3F%20Journal%20of%20Economics%20%26amp%3B%20Management%20Strategy%202016%3B25%3A6%26%23x2013%3B31.%20%26lt%3Ba%20class%3D%26%23039%3Bzp-DOIURL%26%23039%3B%20href%3D%26%23039%3Bhttps%3A%5C%2F%5C%2Fdoi.org%5C%2F10.1111%5C%2Fjems.12141%26%23039%3B%26gt%3Bhttps%3A%5C%2F%5C%2Fdoi.org%5C%2F10.1111%5C%2Fjems.12141%26lt%3B%5C%2Fa%26gt%3B.%26lt%3B%5C%2Fdiv%26gt%3B%5Cn%20%20%26lt%3B%5C%2Fdiv%26gt%3B%5Cn%26lt%3B%5C%2Fdiv%26gt%3B%22%2C%22data%22%3A%7B%22itemType%22%3A%22journalArticle%22%2C%22title%22%3A%22Search%20Engine%20Optimization%3A%20What%20Drives%20Organic%20Traffic%20to%20Retail%20Sites%3F%22%2C%22creators%22%3A%5B%7B%22creatorType%22%3A%22author%22%2C%22firstName%22%3A%22Michael%20R.%22%2C%22lastName%22%3A%22Baye%22%7D%2C%7B%22creatorType%22%3A%22author%22%2C%22firstName%22%3A%22Babur%22%2C%22lastName%22%3A%22De%20Los%20Santos%22%7D%2C%7B%22creatorType%22%3A%22author%22%2C%22firstName%22%3A%22Matthijs%20R.%22%2C%22lastName%22%3A%22Wildenbeest%22%7D%5D%2C%22abstractNote%22%3A%22%22%2C%22date%22%3A%2203%5C%2F2016%22%2C%22language%22%3A%22en%22%2C%22DOI%22%3A%2210.1111%5C%2Fjems.12141%22%2C%22ISSN%22%3A%221058-6407%2C%201530-9134%22%2C%22url%22%3A%22https%3A%5C%2F%5C%2Fonlinelibrary.wiley.com%5C%2Fdoi%5C%2F10.1111%5C%2Fjems.12141%22%2C%22collections%22%3A%5B%22IMP5CR4T%22%5D%2C%22dateModified%22%3A%222023-03-10T16%3A50%3A40Z%22%7D%7D%2C%7B%22key%22%3A%224555S6QE%22%2C%22library%22%3A%7B%22id%22%3A11239602%7D%2C%22meta%22%3A%7B%22creatorSummary%22%3A%22ricoh%22%2C%22numChildren%22%3A0%7D%2C%22bib%22%3A%22%26lt%3Bdiv%20class%3D%26quot%3Bcsl-bib-body%26quot%3B%20style%3D%26quot%3Bline-height%3A%201.35%3B%20%26quot%3B%26gt%3B%5Cn%20%20%26lt%3Bdiv%20class%3D%26quot%3Bcsl-entry%26quot%3B%20style%3D%26quot%3Bclear%3A%20left%3B%20%26quot%3B%26gt%3B%5Cn%20%20%20%20%26lt%3Bdiv%20class%3D%26quot%3Bcsl-left-margin%26quot%3B%20style%3D%26quot%3Bfloat%3A%20left%3B%20padding-right%3A%200.5em%3B%20text-align%3A%20right%3B%20width%3A%201em%3B%26quot%3B%26gt%3B%5B1%5D%26lt%3B%5C%2Fdiv%26gt%3B%26lt%3Bdiv%20class%3D%26quot%3Bcsl-right-inline%26quot%3B%20style%3D%26quot%3Bmargin%3A%200%20.4em%200%201.5em%3B%26quot%3B%26gt%3Bricoh.%20Why%20job%20automation%20Is%20a%20good%20thing.%20Ricoh%20USA%20n.d.%20%26lt%3Ba%20class%3D%26%23039%3Bzp-ItemURL%26%23039%3B%20href%3D%26%23039%3Bhttps%3A%5C%2F%5C%2Fwww.ricoh-usa.com%5C%2Fen%5C%2Finsights%5C%2Farticles%5C%2Fwhy-job-automation-is-a-good-thing%26%23039%3B%26gt%3Bhttps%3A%5C%2F%5C%2Fwww.ricoh-usa.com%5C%2Fen%5C%2Finsights%5C%2Farticles%5C%2Fwhy-job-automation-is-a-good-thing%26lt%3B%5C%2Fa%26gt%3B%20%28accessed%20March%208%2C%202023%29.%26lt%3B%5C%2Fdiv%26gt%3B%5Cn%20%20%26lt%3B%5C%2Fdiv%26gt%3B%5Cn%26lt%3B%5C%2Fdiv%26gt%3B%22%2C%22data%22%3A%7B%22itemType%22%3A%22webpage%22%2C%22title%22%3A%22Why%20job%20automation%20Is%20a%20good%20thing%22%2C%22creators%22%3A%5B%7B%22creatorType%22%3A%22author%22%2C%22firstName%22%3A%22%22%2C%22lastName%22%3A%22ricoh%22%7D%5D%2C%22abstractNote%22%3A%22In%20the%20long%20run%2C%20job%20automation%20will%20expand%20the%20economy%2C%20even%20though%20the%20occupations%20themselves%20may%20be%20different%20from%20the%20ones%20we%20have%20today.%22%2C%22date%22%3A%22%22%2C%22url%22%3A%22https%3A%5C%2F%5C%2Fwww.ricoh-usa.com%5C%2Fen%5C%2Finsights%5C%2Farticles%5C%2Fwhy-job-automation-is-a-good-thing%22%2C%22language%22%3A%22en%22%2C%22collections%22%3A%5B%229GGQIZXR%22%5D%2C%22dateModified%22%3A%222023-03-09T14%3A16%3A53Z%22%7D%7D%2C%7B%22key%22%3A%227UFFBKVI%22%2C%22library%22%3A%7B%22id%22%3A11239602%7D%2C%22meta%22%3A%7B%22creatorSummary%22%3A%22Print%20and%20Digital%22%2C%22parsedDate%22%3A%222013%22%2C%22numChildren%22%3A0%7D%2C%22bib%22%3A%22%26lt%3Bdiv%20class%3D%26quot%3Bcsl-bib-body%26quot%3B%20style%3D%26quot%3Bline-height%3A%201.35%3B%20%26quot%3B%26gt%3B%5Cn%20%20%26lt%3Bdiv%20class%3D%26quot%3Bcsl-entry%26quot%3B%20style%3D%26quot%3Bclear%3A%20left%3B%20%26quot%3B%26gt%3B%5Cn%20%20%20%20%26lt%3Bdiv%20class%3D%26quot%3Bcsl-left-margin%26quot%3B%20style%3D%26quot%3Bfloat%3A%20left%3B%20padding-right%3A%200.5em%3B%20text-align%3A%20right%3B%20width%3A%201em%3B%26quot%3B%26gt%3B%5B1%5D%26lt%3B%5C%2Fdiv%26gt%3B%26lt%3Bdiv%20class%3D%26quot%3Bcsl-right-inline%26quot%3B%20style%3D%26quot%3Bmargin%3A%200%20.4em%200%201.5em%3B%26quot%3B%26gt%3BPrint%2C%20Digital.%20Wikiwand%20-%20Average%20Is%20Over.%20Wikiwand%202013.%20%26lt%3Ba%20class%3D%26%23039%3Bzp-ItemURL%26%23039%3B%20href%3D%26%23039%3Bhttps%3A%5C%2F%5C%2Fwikiwand.com%5C%2Fen%5C%2FAverage_is_Over%26%23039%3B%26gt%3Bhttps%3A%5C%2F%5C%2Fwikiwand.com%5C%2Fen%5C%2FAverage_is_Over%26lt%3B%5C%2Fa%26gt%3B%20%28accessed%20March%208%2C%202023%29.%26lt%3B%5C%2Fdiv%26gt%3B%5Cn%20%20%26lt%3B%5C%2Fdiv%26gt%3B%5Cn%26lt%3B%5C%2Fdiv%26gt%3B%22%2C%22data%22%3A%7B%22itemType%22%3A%22webpage%22%2C%22title%22%3A%22Wikiwand%20-%20Average%20Is%20Over%22%2C%22creators%22%3A%5B%7B%22creatorType%22%3A%22author%22%2C%22name%22%3A%22Print%22%7D%2C%7B%22creatorType%22%3A%22author%22%2C%22name%22%3A%22Digital%22%7D%5D%2C%22abstractNote%22%3A%22Average%20Is%20Over%3A%20Powering%20America%20Beyond%20the%20Age%20of%20the%20Great%20Stagnation%20is%20a%202013%20book%20by%20economist%20Tyler%20Cowen%20laying%20out%20his%20vision%20for%20the%20future%20trajectory%20of%20the%20global%20economy.%20It%20is%20a%20sequel%20to%20Cowen%26%23039%3Bs%202011%20pamphlet%20The%20Great%20Stagnation%2C%20which%20argued%20that%20America%20had%20exhausted%20many%20of%20the%20low-hanging%20fruit%20that%20had%20powered%20its%20growth%20in%20the%2019th%20and%20early%2020th%20century.%22%2C%22date%22%3A%222013%22%2C%22url%22%3A%22https%3A%5C%2F%5C%2Fwikiwand.com%5C%2Fen%5C%2FAverage_is_Over%22%2C%22language%22%3A%22%22%2C%22collections%22%3A%5B%229GGQIZXR%22%5D%2C%22dateModified%22%3A%222023-03-09T14%3A14%3A23Z%22%7D%7D%2C%7B%22key%22%3A%22MPZ26UG2%22%2C%22library%22%3A%7B%22id%22%3A11239602%7D%2C%22meta%22%3A%7B%22creatorSummary%22%3A%22Winship%22%2C%22parsedDate%22%3A%222013-06-28%22%2C%22numChildren%22%3A0%7D%2C%22bib%22%3A%22%26lt%3Bdiv%20class%3D%26quot%3Bcsl-bib-body%26quot%3B%20style%3D%26quot%3Bline-height%3A%201.35%3B%20%26quot%3B%26gt%3B%5Cn%20%20%26lt%3Bdiv%20class%3D%26quot%3Bcsl-entry%26quot%3B%20style%3D%26quot%3Bclear%3A%20left%3B%20%26quot%3B%26gt%3B%5Cn%20%20%20%20%26lt%3Bdiv%20class%3D%26quot%3Bcsl-left-margin%26quot%3B%20style%3D%26quot%3Bfloat%3A%20left%3B%20padding-right%3A%200.5em%3B%20text-align%3A%20right%3B%20width%3A%201em%3B%26quot%3B%26gt%3B%5B1%5D%26lt%3B%5C%2Fdiv%26gt%3B%26lt%3Bdiv%20class%3D%26quot%3Bcsl-right-inline%26quot%3B%20style%3D%26quot%3Bmargin%3A%200%20.4em%200%201.5em%3B%26quot%3B%26gt%3BWinship%20S.%20Wage%20Trends%3A%20Men%26%23x2019%3Bs%20Rising%20Earnings.%20Brookings%202013.%20%26lt%3Ba%20class%3D%26%23039%3Bzp-ItemURL%26%23039%3B%20href%3D%26%23039%3Bhttps%3A%5C%2F%5C%2Fwww.brookings.edu%5C%2Farticles%5C%2Fwage-trends-mens-rising-earnings%5C%2F%26%23039%3B%26gt%3Bhttps%3A%5C%2F%5C%2Fwww.brookings.edu%5C%2Farticles%5C%2Fwage-trends-mens-rising-earnings%5C%2F%26lt%3B%5C%2Fa%26gt%3B%20%28accessed%20March%209%2C%202023%29.%26lt%3B%5C%2Fdiv%26gt%3B%5Cn%20%20%26lt%3B%5C%2Fdiv%26gt%3B%5Cn%26lt%3B%5C%2Fdiv%26gt%3B%22%2C%22data%22%3A%7B%22itemType%22%3A%22blogPost%22%2C%22title%22%3A%22Wage%20Trends%3A%20Men%5Cu2019s%20Rising%20Earnings%22%2C%22creators%22%3A%5B%7B%22creatorType%22%3A%22author%22%2C%22firstName%22%3A%22Scott%22%2C%22lastName%22%3A%22Winship%22%7D%5D%2C%22abstractNote%22%3A%22Countering%20many%20prevailing%20arguments%2C%20Scott%20Winship%20argues%20that%20when%20properly%20measured%2C%20middle-class%20incomes%20actually%20rose%20by%20at%20least%2030%20percent%20between%201979%20and%202007.%20Winship%20explains%20oversights%20and%20assumptions%20regarding%20sketchy%20data%20in%20an%20oft-cited%20Hamilton%20Project%20report%20on%20falling%20men%26%23039%3Bs%20wages.%22%2C%22blogTitle%22%3A%22Brookings%22%2C%22date%22%3A%22June%2028%2C%202013%22%2C%22url%22%3A%22https%3A%5C%2F%5C%2Fwww.brookings.edu%5C%2Farticles%5C%2Fwage-trends-mens-rising-earnings%5C%2F%22%2C%22language%22%3A%22en-US%22%2C%22collections%22%3A%5B%229GGQIZXR%22%5D%2C%22dateModified%22%3A%222023-03-09T14%3A11%3A59Z%22%7D%7D%2C%7B%22key%22%3A%22BCH8ZBHE%22%2C%22library%22%3A%7B%22id%22%3A11239602%7D%2C%22meta%22%3A%7B%22creatorSummary%22%3A%22Hoffman%22%2C%22parsedDate%22%3A%222015-09-15%22%2C%22numChildren%22%3A0%7D%2C%22bib%22%3A%22%26lt%3Bdiv%20class%3D%26quot%3Bcsl-bib-body%26quot%3B%20style%3D%26quot%3Bline-height%3A%201.35%3B%20%26quot%3B%26gt%3B%5Cn%20%20%26lt%3Bdiv%20class%3D%26quot%3Bcsl-entry%26quot%3B%20style%3D%26quot%3Bclear%3A%20left%3B%20%26quot%3B%26gt%3B%5Cn%20%20%20%20%26lt%3Bdiv%20class%3D%26quot%3Bcsl-left-margin%26quot%3B%20style%3D%26quot%3Bfloat%3A%20left%3B%20padding-right%3A%200.5em%3B%20text-align%3A%20right%3B%20width%3A%201em%3B%26quot%3B%26gt%3B%5B1%5D%26lt%3B%5C%2Fdiv%26gt%3B%26lt%3Bdiv%20class%3D%26quot%3Bcsl-right-inline%26quot%3B%20style%3D%26quot%3Bmargin%3A%200%20.4em%200%201.5em%3B%26quot%3B%26gt%3BHoffman%20R.%20Reid%20Hoffman%3A%20Robots%20Will%20Take%20Our%20Jobs%26%23x2014%3BBut%20We%20Will%20Adapt.%20Time%202015.%20%26lt%3Ba%20class%3D%26%23039%3Bzp-ItemURL%26%23039%3B%20href%3D%26%23039%3Bhttps%3A%5C%2F%5C%2Ftime.com%5C%2Fcollection-post%5C%2F4030665%5C%2Freid-hoffman-will-ai-overtake-humans%5C%2F%26%23039%3B%26gt%3Bhttps%3A%5C%2F%5C%2Ftime.com%5C%2Fcollection-post%5C%2F4030665%5C%2Freid-hoffman-will-ai-overtake-humans%5C%2F%26lt%3B%5C%2Fa%26gt%3B%20%28accessed%20March%209%2C%202023%29.%26lt%3B%5C%2Fdiv%26gt%3B%5Cn%20%20%26lt%3B%5C%2Fdiv%26gt%3B%5Cn%26lt%3B%5C%2Fdiv%26gt%3B%22%2C%22data%22%3A%7B%22itemType%22%3A%22webpage%22%2C%22title%22%3A%22Reid%20Hoffman%3A%20Robots%20Will%20Take%20Our%20Jobs%5Cu2014But%20We%20Will%20Adapt%22%2C%22creators%22%3A%5B%7B%22creatorType%22%3A%22author%22%2C%22firstName%22%3A%22Reid%22%2C%22lastName%22%3A%22Hoffman%22%7D%5D%2C%22abstractNote%22%3A%22We%5Cu2019ll%20reinvent%20work%20and%20forge%20a%20new%20set%20of%20jobs%22%2C%22date%22%3A%222015-09-15T18%3A00%3A23.000Z%22%2C%22url%22%3A%22https%3A%5C%2F%5C%2Ftime.com%5C%2Fcollection-post%5C%2F4030665%5C%2Freid-hoffman-will-ai-overtake-humans%5C%2F%22%2C%22language%22%3A%22en%22%2C%22collections%22%3A%5B%229GGQIZXR%22%5D%2C%22dateModified%22%3A%222023-03-09T14%3A11%3A22Z%22%7D%7D%2C%7B%22key%22%3A%229IUISRUP%22%2C%22library%22%3A%7B%22id%22%3A11239602%7D%2C%22meta%22%3A%7B%22creatorSummary%22%3A%22Stern%22%2C%22parsedDate%22%3A%222016-12-25%22%2C%22numChildren%22%3A0%7D%2C%22bib%22%3A%22%26lt%3Bdiv%20class%3D%26quot%3Bcsl-bib-body%26quot%3B%20style%3D%26quot%3Bline-height%3A%201.35%3B%20%26quot%3B%26gt%3B%5Cn%20%20%26lt%3Bdiv%20class%3D%26quot%3Bcsl-entry%26quot%3B%20style%3D%26quot%3Bclear%3A%20left%3B%20%26quot%3B%26gt%3B%5Cn%20%20%20%20%26lt%3Bdiv%20class%3D%26quot%3Bcsl-left-margin%26quot%3B%20style%3D%26quot%3Bfloat%3A%20left%3B%20padding-right%3A%200.5em%3B%20text-align%3A%20right%3B%20width%3A%201em%3B%26quot%3B%26gt%3B%5B1%5D%26lt%3B%5C%2Fdiv%26gt%3B%26lt%3Bdiv%20class%3D%26quot%3Bcsl-right-inline%26quot%3B%20style%3D%26quot%3Bmargin%3A%200%20.4em%200%201.5em%3B%26quot%3B%26gt%3BStern%20A.%20Is%20a%20Universal%20Basic%20Income%20the%20Answer%20to%20Automation-Caused%20Unemployment%3F%20Futurism%202016.%20%26lt%3Ba%20class%3D%26%23039%3Bzp-ItemURL%26%23039%3B%20href%3D%26%23039%3Bhttps%3A%5C%2F%5C%2Ffuturism.com%5C%2Fis-a-universal-basic-income-the-answer-to-automation-caused-unemployment%26%23039%3B%26gt%3Bhttps%3A%5C%2F%5C%2Ffuturism.com%5C%2Fis-a-universal-basic-income-the-answer-to-automation-caused-unemployment%26lt%3B%5C%2Fa%26gt%3B%20%28accessed%20March%209%2C%202023%29.%26lt%3B%5C%2Fdiv%26gt%3B%5Cn%20%20%26lt%3B%5C%2Fdiv%26gt%3B%5Cn%26lt%3B%5C%2Fdiv%26gt%3B%22%2C%22data%22%3A%7B%22itemType%22%3A%22webpage%22%2C%22title%22%3A%22Is%20a%20Universal%20Basic%20Income%20the%20Answer%20to%20Automation-Caused%20Unemployment%3F%22%2C%22creators%22%3A%5B%7B%22creatorType%22%3A%22author%22%2C%22firstName%22%3A%22Andy%22%2C%22lastName%22%3A%22Stern%22%7D%5D%2C%22abstractNote%22%3A%22With%20automation%20poised%20to%20take%20over%20an%20estimated%2057%20percent%20of%20jobs%2C%20many%20are%20turning%20to%20universal%20basic%20income%20%28UBI%29%20as%20a%20possible%20solution%20to%20widespread%20unemployment.%5CnUBI%20systems%20are%20already%20being%20tested%20in%20countries%20such%20as%20Canada%2C%20Finland%2C%20and%20the%20Netherlands%2C%20so%20hard%20data%20on%20the%20practicality%20of%20such%20systems%20should%20be%20forthcoming.%22%2C%22date%22%3A%22December.%2025.%202016%22%2C%22url%22%3A%22https%3A%5C%2F%5C%2Ffuturism.com%5C%2Fis-a-universal-basic-income-the-answer-to-automation-caused-unemployment%22%2C%22language%22%3A%22%22%2C%22collections%22%3A%5B%229GGQIZXR%22%5D%2C%22dateModified%22%3A%222023-03-09T14%3A09%3A39Z%22%7D%7D%2C%7B%22key%22%3A%22GG4P5PMH%22%2C%22library%22%3A%7B%22id%22%3A11239602%7D%2C%22meta%22%3A%7B%22creatorSummary%22%3A%22HOUSER%22%2C%22parsedDate%22%3A%222017-03-18%22%2C%22numChildren%22%3A0%7D%2C%22bib%22%3A%22%26lt%3Bdiv%20class%3D%26quot%3Bcsl-bib-body%26quot%3B%20style%3D%26quot%3Bline-height%3A%201.35%3B%20%26quot%3B%26gt%3B%5Cn%20%20%26lt%3Bdiv%20class%3D%26quot%3Bcsl-entry%26quot%3B%20style%3D%26quot%3Bclear%3A%20left%3B%20%26quot%3B%26gt%3B%5Cn%20%20%20%20%26lt%3Bdiv%20class%3D%26quot%3Bcsl-left-margin%26quot%3B%20style%3D%26quot%3Bfloat%3A%20left%3B%20padding-right%3A%200.5em%3B%20text-align%3A%20right%3B%20width%3A%201em%3B%26quot%3B%26gt%3B%5B1%5D%26lt%3B%5C%2Fdiv%26gt%3B%26lt%3Bdiv%20class%3D%26quot%3Bcsl-right-inline%26quot%3B%20style%3D%26quot%3Bmargin%3A%200%20.4em%200%201.5em%3B%26quot%3B%26gt%3BHOUSER%20K.%20Experts%20Think%20UBI%20Is%20the%20Solution%20to%20Automation.%20This%20Year%2C%20We%26%23x2019%3Bll%20Find%20Out.%20Futurism%202017.%20%26lt%3Ba%20class%3D%26%23039%3Bzp-ItemURL%26%23039%3B%20href%3D%26%23039%3Bhttps%3A%5C%2F%5C%2Ffuturism.com%5C%2Fexperts-think-ubi-is-the-solution-to-automation-this-year-well-find-out%26%23039%3B%26gt%3Bhttps%3A%5C%2F%5C%2Ffuturism.com%5C%2Fexperts-think-ubi-is-the-solution-to-automation-this-year-well-find-out%26lt%3B%5C%2Fa%26gt%3B%20%28accessed%20March%209%2C%202023%29.%26lt%3B%5C%2Fdiv%26gt%3B%5Cn%20%20%26lt%3B%5C%2Fdiv%26gt%3B%5Cn%26lt%3B%5C%2Fdiv%26gt%3B%22%2C%22data%22%3A%7B%22itemType%22%3A%22webpage%22%2C%22title%22%3A%22Experts%20Think%20UBI%20Is%20the%20Solution%20to%20Automation.%20This%20Year%2C%20We%27ll%20Find%20Out.%22%2C%22creators%22%3A%5B%7B%22creatorType%22%3A%22author%22%2C%22firstName%22%3A%22KRISTIN%22%2C%22lastName%22%3A%22HOUSER%22%7D%5D%2C%22abstractNote%22%3A%22UBI%20could%20be%20the%20solution%20to%20automation-caused%20unemployment.%22%2C%22date%22%3A%22March%2C%2018%2C%202017%22%2C%22url%22%3A%22https%3A%5C%2F%5C%2Ffuturism.com%5C%2Fexperts-think-ubi-is-the-solution-to-automation-this-year-well-find-out%22%2C%22language%22%3A%22%22%2C%22collections%22%3A%5B%229GGQIZXR%22%5D%2C%22dateModified%22%3A%222023-03-09T14%3A08%3A33Z%22%7D%7D%2C%7B%22key%22%3A%22RI3B7VVV%22%2C%22library%22%3A%7B%22id%22%3A11239602%7D%2C%22meta%22%3A%7B%22creatorSummary%22%3A%22Flows%22%2C%22parsedDate%22%3A%222013-02-18%22%2C%22numChildren%22%3A0%7D%2C%22bib%22%3A%22%26lt%3Bdiv%20class%3D%26quot%3Bcsl-bib-body%26quot%3B%20style%3D%26quot%3Bline-height%3A%201.35%3B%20%26quot%3B%26gt%3B%5Cn%20%20%26lt%3Bdiv%20class%3D%26quot%3Bcsl-entry%26quot%3B%20style%3D%26quot%3Bclear%3A%20left%3B%20%26quot%3B%26gt%3B%5Cn%20%20%20%20%26lt%3Bdiv%20class%3D%26quot%3Bcsl-left-margin%26quot%3B%20style%3D%26quot%3Bfloat%3A%20left%3B%20padding-right%3A%200.5em%3B%20text-align%3A%20right%3B%20width%3A%201em%3B%26quot%3B%26gt%3B%5B1%5D%26lt%3B%5C%2Fdiv%26gt%3B%26lt%3Bdiv%20class%3D%26quot%3Bcsl-right-inline%26quot%3B%20style%3D%26quot%3Bmargin%3A%200%20.4em%200%201.5em%3B%26quot%3B%26gt%3BFlows%20C.%20A%20Cheerful%20Welcome%20To%20The%20Robots%2C%20Our%20Future%20Work%20Overlords.%20Forbes%202013.%20%26lt%3Ba%20class%3D%26%23039%3Bzp-ItemURL%26%23039%3B%20href%3D%26%23039%3Bhttps%3A%5C%2F%5C%2Fwww.forbes.com%5C%2Fsites%5C%2Frealspin%5C%2F2013%5C%2F02%5C%2F18%5C%2Fa-cheerful-welcome-to-the-robots-our-future-work-overlords%5C%2F%26%23039%3B%26gt%3Bhttps%3A%5C%2F%5C%2Fwww.forbes.com%5C%2Fsites%5C%2Frealspin%5C%2F2013%5C%2F02%5C%2F18%5C%2Fa-cheerful-welcome-to-the-robots-our-future-work-overlords%5C%2F%26lt%3B%5C%2Fa%26gt%3B%20%28accessed%20March%209%2C%202023%29.%26lt%3B%5C%2Fdiv%26gt%3B%5Cn%20%20%26lt%3B%5C%2Fdiv%26gt%3B%5Cn%26lt%3B%5C%2Fdiv%26gt%3B%22%2C%22data%22%3A%7B%22itemType%22%3A%22webpage%22%2C%22title%22%3A%22A%20Cheerful%20Welcome%20To%20The%20Robots%2C%20Our%20Future%20Work%20Overlords%22%2C%22creators%22%3A%5B%7B%22creatorType%22%3A%22author%22%2C%22firstName%22%3A%22Capital%22%2C%22lastName%22%3A%22Flows%22%7D%5D%2C%22abstractNote%22%3A%22Fear%20of%20a%20Matrix-Style%20dystopia%20is%20irrational.%22%2C%22date%22%3A%22Feb%2018%2C%202013%22%2C%22url%22%3A%22https%3A%5C%2F%5C%2Fwww.forbes.com%5C%2Fsites%5C%2Frealspin%5C%2F2013%5C%2F02%5C%2F18%5C%2Fa-cheerful-welcome-to-the-robots-our-future-work-overlords%5C%2F%22%2C%22language%22%3A%22en%22%2C%22collections%22%3A%5B%229GGQIZXR%22%5D%2C%22dateModified%22%3A%222023-03-09T14%3A06%3A36Z%22%7D%7D%2C%7B%22key%22%3A%22IHN3X3BW%22%2C%22library%22%3A%7B%22id%22%3A11239602%7D%2C%22meta%22%3A%7B%22creatorSummary%22%3A%22Cabrales%20et%20al.%22%2C%22parsedDate%22%3A%222020-12-16%22%2C%22numChildren%22%3A0%7D%2C%22bib%22%3A%22%26lt%3Bdiv%20class%3D%26quot%3Bcsl-bib-body%26quot%3B%20style%3D%26quot%3Bline-height%3A%201.35%3B%20%26quot%3B%26gt%3B%5Cn%20%20%26lt%3Bdiv%20class%3D%26quot%3Bcsl-entry%26quot%3B%20style%3D%26quot%3Bclear%3A%20left%3B%20%26quot%3B%26gt%3B%5Cn%20%20%20%20%26lt%3Bdiv%20class%3D%26quot%3Bcsl-left-margin%26quot%3B%20style%3D%26quot%3Bfloat%3A%20left%3B%20padding-right%3A%200.5em%3B%20text-align%3A%20right%3B%20width%3A%201em%3B%26quot%3B%26gt%3B%5B1%5D%26lt%3B%5C%2Fdiv%26gt%3B%26lt%3Bdiv%20class%3D%26quot%3Bcsl-right-inline%26quot%3B%20style%3D%26quot%3Bmargin%3A%200%20.4em%200%201.5em%3B%26quot%3B%26gt%3BCabrales%20A%2C%20Hern%26%23xE1%3Bndez%20P%2C%20S%26%23xE1%3Bnchez%20A.%20Robots%2C%20labor%20markets%2C%20and%20universal%20basic%20income.%20Humanit%20Soc%20Sci%20Commun%202020%3B7%3A1%26%23x2013%3B8.%20%26lt%3Ba%20class%3D%26%23039%3Bzp-DOIURL%26%23039%3B%20href%3D%26%23039%3Bhttps%3A%5C%2F%5C%2Fdoi.org%5C%2F10.1057%5C%2Fs41599-020-00676-8%26%23039%3B%26gt%3Bhttps%3A%5C%2F%5C%2Fdoi.org%5C%2F10.1057%5C%2Fs41599-020-00676-8%26lt%3B%5C%2Fa%26gt%3B.%26lt%3B%5C%2Fdiv%26gt%3B%5Cn%20%20%26lt%3B%5C%2Fdiv%26gt%3B%5Cn%26lt%3B%5C%2Fdiv%26gt%3B%22%2C%22data%22%3A%7B%22itemType%22%3A%22journalArticle%22%2C%22title%22%3A%22Robots%2C%20labor%20markets%2C%20and%20universal%20basic%20income%22%2C%22creators%22%3A%5B%7B%22creatorType%22%3A%22author%22%2C%22firstName%22%3A%22Antonio%22%2C%22lastName%22%3A%22Cabrales%22%7D%2C%7B%22creatorType%22%3A%22author%22%2C%22firstName%22%3A%22Pen%5Cu00e9lope%22%2C%22lastName%22%3A%22Hern%5Cu00e1ndez%22%7D%2C%7B%22creatorType%22%3A%22author%22%2C%22firstName%22%3A%22Angel%22%2C%22lastName%22%3A%22S%5Cu00e1nchez%22%7D%5D%2C%22abstractNote%22%3A%22Automation%20is%20a%20big%20concern%20in%20modern%20societies%20in%20view%20of%20its%20widespread%20impact%20on%20many%20socioeconomic%20issues%20including%20income%2C%20jobs%2C%20and%20productivity.%20While%20previous%20studies%20have%20concentrated%20on%20determining%20the%20effects%20on%20jobs%20and%20salaries%2C%20our%20aim%20is%20to%20understand%20how%20automation%20affects%20productivity%2C%20and%20how%20some%20policies%2C%20such%20as%20taxes%20on%20robots%20or%20universal%20basic%20income%2C%20moderate%20or%20aggravate%20those%20effects.%20To%20this%20end%2C%20we%20have%20designed%20an%20experiment%20where%20workers%20make%20productive%20effort%20decisions%2C%20and%20managers%20can%20choose%20between%20workers%20and%20robots%20to%20do%20these%20tasks.%20In%20our%20baseline%20treatment%2C%20we%20measure%20the%20effort%20made%20by%20workers%20who%20may%20be%20replaced%20by%20robots%2C%20and%20also%20elicit%20firm%20replacement%20decisions.%20Subsequently%2C%20we%20carry%20out%20treatments%20in%20which%20workers%20have%20a%20universal%20basic%20income%20of%20about%20a%20fifth%20of%20the%20workers%5Cu2019%20median%20wages%2C%20or%20where%20there%20is%20a%20tax%20levy%20on%20firms%20who%20replace%20workers%20by%20robots.%20We%20complete%20the%20picture%20of%20the%20impact%20of%20automation%20by%20looking%20into%20the%20coexistence%20of%20workers%20and%20robots%20with%20part-time%20jobs.%20We%20find%20that%20the%20threat%20of%20a%20robot%20substitution%20does%20not%20affect%20the%20amount%20of%20effort%20exerted%20by%20workers.%20Also%2C%20neither%20universal%20basic%20income%20nor%20a%20tax%20on%20robots%20decrease%20workers%5Cu2019%20effort.%20We%20observe%20that%20the%20robot%20substitution%20tax%20reduces%20the%20probability%20of%20worker%20substitution.%20Finally%2C%20workers%20that%20benefit%20from%20managerial%20decisions%20to%20not%20substitute%20them%20by%20more%20productive%20robots%20do%20not%20increase%20their%20effort%20level.%20Our%20conclusions%20shed%20light%20on%20the%20interplay%20of%20policy%20and%20workers%20behavior%20under%20pervasive%20automation.%22%2C%22date%22%3A%222020-12-16%22%2C%22language%22%3A%22en%22%2C%22DOI%22%3A%2210.1057%5C%2Fs41599-020-00676-8%22%2C%22ISSN%22%3A%222662-9992%22%2C%22url%22%3A%22https%3A%5C%2F%5C%2Fwww.nature.com%5C%2Farticles%5C%2Fs41599-020-00676-8%22%2C%22collections%22%3A%5B%229GGQIZXR%22%5D%2C%22dateModified%22%3A%222023-03-09T13%3A27%3A12Z%22%7D%7D%2C%7B%22key%22%3A%226GDQ62ZG%22%2C%22library%22%3A%7B%22id%22%3A11239602%7D%2C%22meta%22%3A%7B%22creatorSummary%22%3A%22MSc%22%2C%22parsedDate%22%3A%222022-04-14%22%2C%22numChildren%22%3A0%7D%2C%22bib%22%3A%22%26lt%3Bdiv%20class%3D%26quot%3Bcsl-bib-body%26quot%3B%20style%3D%26quot%3Bline-height%3A%201.35%3B%20%26quot%3B%26gt%3B%5Cn%20%20%26lt%3Bdiv%20class%3D%26quot%3Bcsl-entry%26quot%3B%20style%3D%26quot%3Bclear%3A%20left%3B%20%26quot%3B%26gt%3B%5Cn%20%20%20%20%26lt%3Bdiv%20class%3D%26quot%3Bcsl-left-margin%26quot%3B%20style%3D%26quot%3Bfloat%3A%20left%3B%20padding-right%3A%200.5em%3B%20text-align%3A%20right%3B%20width%3A%201em%3B%26quot%3B%26gt%3B%5B1%5D%26lt%3B%5C%2Fdiv%26gt%3B%26lt%3Bdiv%20class%3D%26quot%3Bcsl-right-inline%26quot%3B%20style%3D%26quot%3Bmargin%3A%200%20.4em%200%201.5em%3B%26quot%3B%26gt%3BMSc%20PA.%20Why%20Every%20Job%20Lost%20to%20Automation%20Brings%20Us%20One%20Step%20Closer%20to%20a%20Universal%20Basic%20Income.%20Medium%202022.%20%26lt%3Ba%20class%3D%26%23039%3Bzp-ItemURL%26%23039%3B%20href%3D%26%23039%3Bhttps%3A%5C%2F%5C%2Faninjusticemag.com%5C%2Fwhy-every-job-lost-to-automation-brings-us-one-step-closer-to-a-universal-basic-income-8b357d36d770%26%23039%3B%26gt%3Bhttps%3A%5C%2F%5C%2Faninjusticemag.com%5C%2Fwhy-every-job-lost-to-automation-brings-us-one-step-closer-to-a-universal-basic-income-8b357d36d770%26lt%3B%5C%2Fa%26gt%3B%20%28accessed%20March%209%2C%202023%29.%26lt%3B%5C%2Fdiv%26gt%3B%5Cn%20%20%26lt%3B%5C%2Fdiv%26gt%3B%5Cn%26lt%3B%5C%2Fdiv%26gt%3B%22%2C%22data%22%3A%7B%22itemType%22%3A%22webpage%22%2C%22title%22%3A%22Why%20Every%20Job%20Lost%20to%20Automation%20Brings%20Us%20One%20Step%20Closer%20to%20a%20Universal%20Basic%20Income%22%2C%22creators%22%3A%5B%7B%22creatorType%22%3A%22author%22%2C%22firstName%22%3A%22Paul%20Abela%22%2C%22lastName%22%3A%22MSc%22%7D%5D%2C%22abstractNote%22%3A%22Automation%20has%20always%20been%20something%20to%20fear%2C%20but%20it%20should%20be%20something%20to%20celebrate%22%2C%22date%22%3A%222022-04-14T21%3A33%3A30.704Z%22%2C%22url%22%3A%22https%3A%5C%2F%5C%2Faninjusticemag.com%5C%2Fwhy-every-job-lost-to-automation-brings-us-one-step-closer-to-a-universal-basic-income-8b357d36d770%22%2C%22language%22%3A%22en%22%2C%22collections%22%3A%5B%229GGQIZXR%22%5D%2C%22dateModified%22%3A%222023-03-09T12%3A58%3A43Z%22%7D%7D%2C%7B%22key%22%3A%22M42SARDH%22%2C%22library%22%3A%7B%22id%22%3A11239602%7D%2C%22meta%22%3A%7B%22creatorSummary%22%3A%22Frey%20and%20Osborne%22%2C%22parsedDate%22%3A%222017%22%2C%22numChildren%22%3A0%7D%2C%22bib%22%3A%22%26lt%3Bdiv%20class%3D%26quot%3Bcsl-bib-body%26quot%3B%20style%3D%26quot%3Bline-height%3A%201.35%3B%20%26quot%3B%26gt%3B%5Cn%20%20%26lt%3Bdiv%20class%3D%26quot%3Bcsl-entry%26quot%3B%20style%3D%26quot%3Bclear%3A%20left%3B%20%26quot%3B%26gt%3B%5Cn%20%20%20%20%26lt%3Bdiv%20class%3D%26quot%3Bcsl-left-margin%26quot%3B%20style%3D%26quot%3Bfloat%3A%20left%3B%20padding-right%3A%200.5em%3B%20text-align%3A%20right%3B%20width%3A%201em%3B%26quot%3B%26gt%3B%5B1%5D%26lt%3B%5C%2Fdiv%26gt%3B%26lt%3Bdiv%20class%3D%26quot%3Bcsl-right-inline%26quot%3B%20style%3D%26quot%3Bmargin%3A%200%20.4em%200%201.5em%3B%26quot%3B%26gt%3BFrey%20CB%2C%20Osborne%20MA.%20The%20future%20of%20employment%3A%20How%20susceptible%20are%20jobs%20to%20computerisation%3F%20Technological%20Forecasting%20and%20Social%20Change%202017%3B114%3A254%26%23x2013%3B80.%20%26lt%3Ba%20class%3D%26%23039%3Bzp-DOIURL%26%23039%3B%20href%3D%26%23039%3Bhttps%3A%5C%2F%5C%2Fdoi.org%5C%2F10.1016%5C%2Fj.techfore.2016.08.019%26%23039%3B%26gt%3Bhttps%3A%5C%2F%5C%2Fdoi.org%5C%2F10.1016%5C%2Fj.techfore.2016.08.019%26lt%3B%5C%2Fa%26gt%3B.%26lt%3B%5C%2Fdiv%26gt%3B%5Cn%20%20%26lt%3B%5C%2Fdiv%26gt%3B%5Cn%26lt%3B%5C%2Fdiv%26gt%3B%22%2C%22data%22%3A%7B%22itemType%22%3A%22journalArticle%22%2C%22title%22%3A%22The%20future%20of%20employment%3A%20How%20susceptible%20are%20jobs%20to%20computerisation%3F%22%2C%22creators%22%3A%5B%7B%22creatorType%22%3A%22author%22%2C%22firstName%22%3A%22Carl%20Benedikt%22%2C%22lastName%22%3A%22Frey%22%7D%2C%7B%22creatorType%22%3A%22author%22%2C%22firstName%22%3A%22Michael%20A.%22%2C%22lastName%22%3A%22Osborne%22%7D%5D%2C%22abstractNote%22%3A%22%22%2C%22date%22%3A%2201%5C%2F2017%22%2C%22language%22%3A%22en%22%2C%22DOI%22%3A%2210.1016%5C%2Fj.techfore.2016.08.019%22%2C%22ISSN%22%3A%2200401625%22%2C%22url%22%3A%22https%3A%5C%2F%5C%2Flinkinghub.elsevier.com%5C%2Fretrieve%5C%2Fpii%5C%2FS0040162516302244%22%2C%22collections%22%3A%5B%229GGQIZXR%22%5D%2C%22dateModified%22%3A%222023-03-09T11%3A12%3A32Z%22%7D%7D%2C%7B%22key%22%3A%222HB964M6%22%2C%22library%22%3A%7B%22id%22%3A11239602%7D%2C%22meta%22%3A%7B%22creatorSummary%22%3A%22Holzer%22%2C%22parsedDate%22%3A%222022-01-19%22%2C%22numChildren%22%3A0%7D%2C%22bib%22%3A%22%26lt%3Bdiv%20class%3D%26quot%3Bcsl-bib-body%26quot%3B%20style%3D%26quot%3Bline-height%3A%201.35%3B%20%26quot%3B%26gt%3B%5Cn%20%20%26lt%3Bdiv%20class%3D%26quot%3Bcsl-entry%26quot%3B%20style%3D%26quot%3Bclear%3A%20left%3B%20%26quot%3B%26gt%3B%5Cn%20%20%20%20%26lt%3Bdiv%20class%3D%26quot%3Bcsl-left-margin%26quot%3B%20style%3D%26quot%3Bfloat%3A%20left%3B%20padding-right%3A%200.5em%3B%20text-align%3A%20right%3B%20width%3A%201em%3B%26quot%3B%26gt%3B%5B1%5D%26lt%3B%5C%2Fdiv%26gt%3B%26lt%3Bdiv%20class%3D%26quot%3Bcsl-right-inline%26quot%3B%20style%3D%26quot%3Bmargin%3A%200%20.4em%200%201.5em%3B%26quot%3B%26gt%3BHolzer%20HJ.%20Understanding%20the%20impact%20of%20automation%20on%20workers%2C%20jobs%2C%20and%20wages.%20Brookings%202022.%20%26lt%3Ba%20class%3D%26%23039%3Bzp-ItemURL%26%23039%3B%20href%3D%26%23039%3Bhttps%3A%5C%2F%5C%2Fwww.brookings.edu%5C%2Fblog%5C%2Fup-front%5C%2F2022%5C%2F01%5C%2F19%5C%2Funderstanding-the-impact-of-automation-on-workers-jobs-and-wages%5C%2F%26%23039%3B%26gt%3Bhttps%3A%5C%2F%5C%2Fwww.brookings.edu%5C%2Fblog%5C%2Fup-front%5C%2F2022%5C%2F01%5C%2F19%5C%2Funderstanding-the-impact-of-automation-on-workers-jobs-and-wages%5C%2F%26lt%3B%5C%2Fa%26gt%3B%20%28accessed%20March%209%2C%202023%29.%26lt%3B%5C%2Fdiv%26gt%3B%5Cn%20%20%26lt%3B%5C%2Fdiv%26gt%3B%5Cn%26lt%3B%5C%2Fdiv%26gt%3B%22%2C%22data%22%3A%7B%22itemType%22%3A%22blogPost%22%2C%22title%22%3A%22Understanding%20the%20impact%20of%20automation%20on%20workers%2C%20jobs%2C%20and%20wages%22%2C%22creators%22%3A%5B%7B%22creatorType%22%3A%22author%22%2C%22firstName%22%3A%22Harry%20J.%22%2C%22lastName%22%3A%22Holzer%22%7D%5D%2C%22abstractNote%22%3A%22Harry%20J.%20Holzer%20examines%20the%20implications%20of%20automation%20for%20jobs%20and%20wages.%22%2C%22blogTitle%22%3A%22Brookings%22%2C%22date%22%3A%222022-01-19T21%3A30%3A20%2B00%3A00%22%2C%22url%22%3A%22https%3A%5C%2F%5C%2Fwww.brookings.edu%5C%2Fblog%5C%2Fup-front%5C%2F2022%5C%2F01%5C%2F19%5C%2Funderstanding-the-impact-of-automation-on-workers-jobs-and-wages%5C%2F%22%2C%22language%22%3A%22en-US%22%2C%22collections%22%3A%5B%229GGQIZXR%22%5D%2C%22dateModified%22%3A%222023-03-09T10%3A36%3A30Z%22%7D%7D%2C%7B%22key%22%3A%226GUMWUE3%22%2C%22library%22%3A%7B%22id%22%3A11239602%7D%2C%22meta%22%3A%7B%22creatorSummary%22%3A%22Winship%22%2C%22parsedDate%22%3A%222013-07-16%22%2C%22numChildren%22%3A0%7D%2C%22bib%22%3A%22%26lt%3Bdiv%20class%3D%26quot%3Bcsl-bib-body%26quot%3B%20style%3D%26quot%3Bline-height%3A%201.35%3B%20%26quot%3B%26gt%3B%5Cn%20%20%26lt%3Bdiv%20class%3D%26quot%3Bcsl-entry%26quot%3B%20style%3D%26quot%3Bclear%3A%20left%3B%20%26quot%3B%26gt%3B%5Cn%20%20%20%20%26lt%3Bdiv%20class%3D%26quot%3Bcsl-left-margin%26quot%3B%20style%3D%26quot%3Bfloat%3A%20left%3B%20padding-right%3A%200.5em%3B%20text-align%3A%20right%3B%20width%3A%201em%3B%26quot%3B%26gt%3B%5B1%5D%26lt%3B%5C%2Fdiv%26gt%3B%26lt%3Bdiv%20class%3D%26quot%3Bcsl-right-inline%26quot%3B%20style%3D%26quot%3Bmargin%3A%200%20.4em%200%201.5em%3B%26quot%3B%26gt%3BWinship%20S.%20For%20the%20Last%20Time%2C%20Robots%20Do%20NOT%20Cause%20Unemployment.%20Brookings%202013.%20%26lt%3Ba%20class%3D%26%23039%3Bzp-ItemURL%26%23039%3B%20href%3D%26%23039%3Bhttps%3A%5C%2F%5C%2Fwww.brookings.edu%5C%2Fopinions%5C%2Ffor-the-last-time-robots-do-not-cause-unemployment%5C%2F%26%23039%3B%26gt%3Bhttps%3A%5C%2F%5C%2Fwww.brookings.edu%5C%2Fopinions%5C%2Ffor-the-last-time-robots-do-not-cause-unemployment%5C%2F%26lt%3B%5C%2Fa%26gt%3B%20%28accessed%20March%209%2C%202023%29.%26lt%3B%5C%2Fdiv%26gt%3B%5Cn%20%20%26lt%3B%5C%2Fdiv%26gt%3B%5Cn%26lt%3B%5C%2Fdiv%26gt%3B%22%2C%22data%22%3A%7B%22itemType%22%3A%22blogPost%22%2C%22title%22%3A%22For%20the%20Last%20Time%2C%20Robots%20Do%20NOT%20Cause%20Unemployment%22%2C%22creators%22%3A%5B%7B%22creatorType%22%3A%22author%22%2C%22firstName%22%3A%22Scott%22%2C%22lastName%22%3A%22Winship%22%7D%5D%2C%22abstractNote%22%3A%22Arguing%20against%20a%20recent%20wave%20of%20fear%20regarding%20%26quot%3Btechnological%20unemployment%26quot%3B%5Cu2014the%20displacement%20of%20workers%20by%20automated%20technologies%5Cu2014Scott%20Winship%20explains%20how%20many%20labor%20improvements%20over%20the%20past%2050%20years%2C%20such%20as%20increased%20leisure%20time%20and%20a%20drop%20in%20typical%20age%20at%20retirement%2C%20have%20come%20thanks%20to%20technological%20progress.%22%2C%22blogTitle%22%3A%22Brookings%22%2C%22date%22%3A%222013-07-16T14%3A17%3A00%2B00%3A00%22%2C%22url%22%3A%22https%3A%5C%2F%5C%2Fwww.brookings.edu%5C%2Fopinions%5C%2Ffor-the-last-time-robots-do-not-cause-unemployment%5C%2F%22%2C%22language%22%3A%22en-US%22%2C%22collections%22%3A%5B%229GGQIZXR%22%5D%2C%22dateModified%22%3A%222023-03-09T09%3A18%3A33Z%22%7D%7D%2C%7B%22key%22%3A%22EWKEEJSB%22%2C%22library%22%3A%7B%22id%22%3A11239602%7D%2C%22meta%22%3A%7B%22creatorSummary%22%3A%22Davenport%22%2C%22parsedDate%22%3A%222015-08-12%22%2C%22numChildren%22%3A0%7D%2C%22bib%22%3A%22%26lt%3Bdiv%20class%3D%26quot%3Bcsl-bib-body%26quot%3B%20style%3D%26quot%3Bline-height%3A%201.35%3B%20%26quot%3B%26gt%3B%5Cn%20%20%26lt%3Bdiv%20class%3D%26quot%3Bcsl-entry%26quot%3B%20style%3D%26quot%3Bclear%3A%20left%3B%20%26quot%3B%26gt%3B%5Cn%20%20%20%20%26lt%3Bdiv%20class%3D%26quot%3Bcsl-left-margin%26quot%3B%20style%3D%26quot%3Bfloat%3A%20left%3B%20padding-right%3A%200.5em%3B%20text-align%3A%20right%3B%20width%3A%201em%3B%26quot%3B%26gt%3B%5B1%5D%26lt%3B%5C%2Fdiv%26gt%3B%26lt%3Bdiv%20class%3D%26quot%3Bcsl-right-inline%26quot%3B%20style%3D%26quot%3Bmargin%3A%200%20.4em%200%201.5em%3B%26quot%3B%26gt%3BDavenport%20TH.%20The%20Rise%20of%20Job-Killing%20Automation%3F%20Not%20So%20Fast.%20Wall%20Street%20Journal%202015.%26lt%3B%5C%2Fdiv%26gt%3B%5Cn%20%20%26lt%3B%5C%2Fdiv%26gt%3B%5Cn%26lt%3B%5C%2Fdiv%26gt%3B%22%2C%22data%22%3A%7B%22itemType%22%3A%22newspaperArticle%22%2C%22title%22%3A%22The%20Rise%20of%20Job-Killing%20Automation%3F%20Not%20So%20Fast%22%2C%22creators%22%3A%5B%7B%22creatorType%22%3A%22author%22%2C%22firstName%22%3A%22Thomas%20H.%22%2C%22lastName%22%3A%22Davenport%22%7D%5D%2C%22abstractNote%22%3A%22Worried%20predictions%20about%20wholesale%20job%20loss%20at%20the%20digital%20hands%20of%20automation%20are%20overblown.%20Automation%20takes%20over%20tasks%2C%20not%20entire%20jobs.%20Be%20concerned%20and%20be%20prepared%2C%20but%20don%5Cu2019t%20believe%20everything%20you%20read.%22%2C%22date%22%3A%222015-08-12T22%3A50%3A00Z%22%2C%22section%22%3A%22The%20CIO%20Report%22%2C%22language%22%3A%22en-US%22%2C%22ISSN%22%3A%220099-9660%22%2C%22url%22%3A%22http%3A%5C%2F%5C%2Fblogs.wsj.com%5C%2Fcio%5C%2F2015%5C%2F08%5C%2F12%5C%2Fthe-rise-of-job-killing-automation-not-so-fast%5C%2F%22%2C%22collections%22%3A%5B%229GGQIZXR%22%5D%2C%22dateModified%22%3A%222023-03-09T07%3A38%3A10Z%22%7D%7D%2C%7B%22key%22%3A%222N3IJBTK%22%2C%22library%22%3A%7B%22id%22%3A11239602%7D%2C%22meta%22%3A%7B%22creatorSummary%22%3A%22Chui%20et%20al.%22%2C%22parsedDate%22%3A%222015-11-01%22%2C%22numChildren%22%3A0%7D%2C%22bib%22%3A%22%26lt%3Bdiv%20class%3D%26quot%3Bcsl-bib-body%26quot%3B%20style%3D%26quot%3Bline-height%3A%201.35%3B%20%26quot%3B%26gt%3B%5Cn%20%20%26lt%3Bdiv%20class%3D%26quot%3Bcsl-entry%26quot%3B%20style%3D%26quot%3Bclear%3A%20left%3B%20%26quot%3B%26gt%3B%5Cn%20%20%20%20%26lt%3Bdiv%20class%3D%26quot%3Bcsl-left-margin%26quot%3B%20style%3D%26quot%3Bfloat%3A%20left%3B%20padding-right%3A%200.5em%3B%20text-align%3A%20right%3B%20width%3A%201em%3B%26quot%3B%26gt%3B%5B1%5D%26lt%3B%5C%2Fdiv%26gt%3B%26lt%3Bdiv%20class%3D%26quot%3Bcsl-right-inline%26quot%3B%20style%3D%26quot%3Bmargin%3A%200%20.4em%200%201.5em%3B%26quot%3B%26gt%3BChui%20M%2C%20Manyika%2C%20James%2C%20Miremadi%20M.%20Four%20fundamentals%20of%20workplace%20automation%20%7C%20McKinsey%202015.%20%26lt%3Ba%20class%3D%26%23039%3Bzp-ItemURL%26%23039%3B%20href%3D%26%23039%3Bhttps%3A%5C%2F%5C%2Fwww.mckinsey.com%5C%2Fcapabilities%5C%2Fmckinsey-digital%5C%2Four-insights%5C%2Ffour-fundamentals-of-workplace-automation%26%23039%3B%26gt%3Bhttps%3A%5C%2F%5C%2Fwww.mckinsey.com%5C%2Fcapabilities%5C%2Fmckinsey-digital%5C%2Four-insights%5C%2Ffour-fundamentals-of-workplace-automation%26lt%3B%5C%2Fa%26gt%3B%20%28accessed%20March%209%2C%202023%29.%26lt%3B%5C%2Fdiv%26gt%3B%5Cn%20%20%26lt%3B%5C%2Fdiv%26gt%3B%5Cn%26lt%3B%5C%2Fdiv%26gt%3B%22%2C%22data%22%3A%7B%22itemType%22%3A%22webpage%22%2C%22title%22%3A%22Four%20fundamentals%20of%20workplace%20automation%20%7C%20McKinsey%22%2C%22creators%22%3A%5B%7B%22creatorType%22%3A%22author%22%2C%22firstName%22%3A%22Michael%22%2C%22lastName%22%3A%22Chui%22%7D%2C%7B%22creatorType%22%3A%22author%22%2C%22name%22%3A%22Manyika%2C%20James%22%7D%2C%7B%22creatorType%22%3A%22author%22%2C%22firstName%22%3A%22Mehdi%22%2C%22lastName%22%3A%22Miremadi%22%7D%5D%2C%22abstractNote%22%3A%22As%20the%20automation%20of%20physical%20and%20knowledge%20work%20advances%2C%20many%20jobs%20will%20be%20redefined%20rather%20than%20eliminated%5Cu2014at%20least%20in%20the%20short%20term.%22%2C%22date%22%3A%22November%201%2C%202015%22%2C%22url%22%3A%22https%3A%5C%2F%5C%2Fwww.mckinsey.com%5C%2Fcapabilities%5C%2Fmckinsey-digital%5C%2Four-insights%5C%2Ffour-fundamentals-of-workplace-automation%22%2C%22language%22%3A%22%22%2C%22collections%22%3A%5B%229GGQIZXR%22%5D%2C%22dateModified%22%3A%222023-03-09T07%3A33%3A35Z%22%7D%7D%2C%7B%22key%22%3A%22A9ZZ9HCQ%22%2C%22library%22%3A%7B%22id%22%3A11239602%7D%2C%22meta%22%3A%7B%22creatorSummary%22%3A%22Thibodeau%22%2C%22parsedDate%22%3A%222016-02-13%22%2C%22numChildren%22%3A0%7D%2C%22bib%22%3A%22%26lt%3Bdiv%20class%3D%26quot%3Bcsl-bib-body%26quot%3B%20style%3D%26quot%3Bline-height%3A%201.35%3B%20%26quot%3B%26gt%3B%5Cn%20%20%26lt%3Bdiv%20class%3D%26quot%3Bcsl-entry%26quot%3B%20style%3D%26quot%3Bclear%3A%20left%3B%20%26quot%3B%26gt%3B%5Cn%20%20%20%20%26lt%3Bdiv%20class%3D%26quot%3Bcsl-left-margin%26quot%3B%20style%3D%26quot%3Bfloat%3A%20left%3B%20padding-right%3A%200.5em%3B%20text-align%3A%20right%3B%20width%3A%201em%3B%26quot%3B%26gt%3B%5B1%5D%26lt%3B%5C%2Fdiv%26gt%3B%26lt%3Bdiv%20class%3D%26quot%3Bcsl-right-inline%26quot%3B%20style%3D%26quot%3Bmargin%3A%200%20.4em%200%201.5em%3B%26quot%3B%26gt%3BThibodeau%20P.%20These%20are%20the%20fastest%20growing%20IT%20jobs.%20Computerworld%202016.%20%26lt%3Ba%20class%3D%26%23039%3Bzp-ItemURL%26%23039%3B%20href%3D%26%23039%3Bhttps%3A%5C%2F%5C%2Fwww.computerworld.com%5C%2Farticle%5C%2F3033091%5C%2Fthese-are-the-fastest-growing-it-jobs.html%26%23039%3B%26gt%3Bhttps%3A%5C%2F%5C%2Fwww.computerworld.com%5C%2Farticle%5C%2F3033091%5C%2Fthese-are-the-fastest-growing-it-jobs.html%26lt%3B%5C%2Fa%26gt%3B%20%28accessed%20March%209%2C%202023%29.%26lt%3B%5C%2Fdiv%26gt%3B%5Cn%20%20%26lt%3B%5C%2Fdiv%26gt%3B%5Cn%26lt%3B%5C%2Fdiv%26gt%3B%22%2C%22data%22%3A%7B%22itemType%22%3A%22webpage%22%2C%22title%22%3A%22These%20are%20the%20fastest%20growing%20IT%20jobs%22%2C%22creators%22%3A%5B%7B%22creatorType%22%3A%22author%22%2C%22firstName%22%3A%22Patrick%22%2C%22lastName%22%3A%22Thibodeau%22%7D%5D%2C%22abstractNote%22%3A%22IT%20employment%20increased%20in%20every%20occupation%20and%20industry%20in%202015%20except%20oil%20and%20gas.%22%2C%22date%22%3A%222016-02-13T04%3A48-05%3A00%22%2C%22url%22%3A%22https%3A%5C%2F%5C%2Fwww.computerworld.com%5C%2Farticle%5C%2F3033091%5C%2Fthese-are-the-fastest-growing-it-jobs.html%22%2C%22language%22%3A%22en%22%2C%22collections%22%3A%5B%229GGQIZXR%22%5D%2C%22dateModified%22%3A%222023-03-09T07%3A20%3A27Z%22%7D%7D%2C%7B%22key%22%3A%22KCIL383H%22%2C%22library%22%3A%7B%22id%22%3A11239602%7D%2C%22meta%22%3A%7B%22creatorSummary%22%3A%22Cole%22%2C%22parsedDate%22%3A%222008-01-01%22%2C%22numChildren%22%3A0%7D%2C%22bib%22%3A%22%26lt%3Bdiv%20class%3D%26quot%3Bcsl-bib-body%26quot%3B%20style%3D%26quot%3Bline-height%3A%201.35%3B%20%26quot%3B%26gt%3B%5Cn%20%20%26lt%3Bdiv%20class%3D%26quot%3Bcsl-entry%26quot%3B%20style%3D%26quot%3Bclear%3A%20left%3B%20%26quot%3B%26gt%3B%5Cn%20%20%20%20%26lt%3Bdiv%20class%3D%26quot%3Bcsl-left-margin%26quot%3B%20style%3D%26quot%3Bfloat%3A%20left%3B%20padding-right%3A%200.5em%3B%20text-align%3A%20right%3B%20width%3A%201em%3B%26quot%3B%26gt%3B%5B1%5D%26lt%3B%5C%2Fdiv%26gt%3B%26lt%3Bdiv%20class%3D%26quot%3Bcsl-right-inline%26quot%3B%20style%3D%26quot%3Bmargin%3A%200%20.4em%200%201.5em%3B%26quot%3B%26gt%3BCole%20J.%20Milton%20Friedman%20on%20Income%20Inequality.%20Journal%20of%20Markets%20and%20Morality%202008%3B11%3A239%26%23x2013%3B53.%26lt%3B%5C%2Fdiv%26gt%3B%5Cn%20%20%26lt%3B%5C%2Fdiv%26gt%3B%5Cn%26lt%3B%5C%2Fdiv%26gt%3B%22%2C%22data%22%3A%7B%22itemType%22%3A%22journalArticle%22%2C%22title%22%3A%22Milton%20Friedman%20on%20Income%20Inequality%22%2C%22creators%22%3A%5B%7B%22creatorType%22%3A%22author%22%2C%22firstName%22%3A%22Julio%22%2C%22lastName%22%3A%22Cole%22%7D%5D%2C%22abstractNote%22%3A%22%22%2C%22date%22%3A%222008-01-01%22%2C%22language%22%3A%22%22%2C%22DOI%22%3A%22%22%2C%22ISSN%22%3A%22%22%2C%22url%22%3A%22https%3A%5C%2F%5C%2Feportfolios.macaulay.cuny.edu%5C%2Fthorne15%5C%2Ffiles%5C%2F2015%5C%2F03%5C%2FCole-Milton-Friedman-on-Income-Inequaity.pdf%22%2C%22collections%22%3A%5B%225FKAUV6X%22%5D%2C%22dateModified%22%3A%222023-03-09T04%3A26%3A23Z%22%7D%7D%2C%7B%22key%22%3A%22WATRG4BP%22%2C%22library%22%3A%7B%22id%22%3A11239602%7D%2C%22meta%22%3A%7B%22creatorSummary%22%3A%22Wallach%22%2C%22parsedDate%22%3A%222020-09-18%22%2C%22numChildren%22%3A0%7D%2C%22bib%22%3A%22%26lt%3Bdiv%20class%3D%26quot%3Bcsl-bib-body%26quot%3B%20style%3D%26quot%3Bline-height%3A%201.35%3B%20%26quot%3B%26gt%3B%5Cn%20%20%26lt%3Bdiv%20class%3D%26quot%3Bcsl-entry%26quot%3B%20style%3D%26quot%3Bclear%3A%20left%3B%20%26quot%3B%26gt%3B%5Cn%20%20%20%20%26lt%3Bdiv%20class%3D%26quot%3Bcsl-left-margin%26quot%3B%20style%3D%26quot%3Bfloat%3A%20left%3B%20padding-right%3A%200.5em%3B%20text-align%3A%20right%3B%20width%3A%201em%3B%26quot%3B%26gt%3B%5B1%5D%26lt%3B%5C%2Fdiv%26gt%3B%26lt%3Bdiv%20class%3D%26quot%3Bcsl-right-inline%26quot%3B%20style%3D%26quot%3Bmargin%3A%200%20.4em%200%201.5em%3B%26quot%3B%26gt%3BWallach%20O.%20Basic%20Income%20Experiments%20Around%20the%20World.%20Visual%20Capitalist%202020.%20%26lt%3Ba%20class%3D%26%23039%3Bzp-ItemURL%26%23039%3B%20href%3D%26%23039%3Bhttps%3A%5C%2F%5C%2Fwww.visualcapitalist.com%5C%2Fmap-basic-income-experiments-world%5C%2F%26%23039%3B%26gt%3Bhttps%3A%5C%2F%5C%2Fwww.visualcapitalist.com%5C%2Fmap-basic-income-experiments-world%5C%2F%26lt%3B%5C%2Fa%26gt%3B%20%28accessed%20March%209%2C%202023%29.%26lt%3B%5C%2Fdiv%26gt%3B%5Cn%20%20%26lt%3B%5C%2Fdiv%26gt%3B%5Cn%26lt%3B%5C%2Fdiv%26gt%3B%22%2C%22data%22%3A%7B%22itemType%22%3A%22webpage%22%2C%22title%22%3A%22Basic%20Income%20Experiments%20Around%20the%20World%22%2C%22creators%22%3A%5B%7B%22creatorType%22%3A%22author%22%2C%22firstName%22%3A%22Omri%22%2C%22lastName%22%3A%22Wallach%22%7D%5D%2C%22abstractNote%22%3A%22Amid%20the%20pandemic%2C%20the%20idea%20of%20Universal%20Basic%20Income%20has%20been%20gaining%20steam%20with%20policymakers.%20Where%20has%20it%20been%20tried%2C%20and%20has%20it%20worked%3F%22%2C%22date%22%3A%222020-09-18T19%3A46%3A01%2B00%3A00%22%2C%22url%22%3A%22https%3A%5C%2F%5C%2Fwww.visualcapitalist.com%5C%2Fmap-basic-income-experiments-world%5C%2F%22%2C%22language%22%3A%22en-US%22%2C%22collections%22%3A%5B%225FKAUV6X%22%5D%2C%22dateModified%22%3A%222023-03-09T04%3A13%3A17Z%22%7D%7D%2C%7B%22key%22%3A%22HT8TSSGS%22%2C%22library%22%3A%7B%22id%22%3A11239602%7D%2C%22meta%22%3A%7B%22creatorSummary%22%3A%22Murray%22%2C%22parsedDate%22%3A%222006%22%2C%22numChildren%22%3A0%7D%2C%22bib%22%3A%22%26lt%3Bdiv%20class%3D%26quot%3Bcsl-bib-body%26quot%3B%20style%3D%26quot%3Bline-height%3A%201.35%3B%20%26quot%3B%26gt%3B%5Cn%20%20%26lt%3Bdiv%20class%3D%26quot%3Bcsl-entry%26quot%3B%20style%3D%26quot%3Bclear%3A%20left%3B%20%26quot%3B%26gt%3B%5Cn%20%20%20%20%26lt%3Bdiv%20class%3D%26quot%3Bcsl-left-margin%26quot%3B%20style%3D%26quot%3Bfloat%3A%20left%3B%20padding-right%3A%200.5em%3B%20text-align%3A%20right%3B%20width%3A%201em%3B%26quot%3B%26gt%3B%5B1%5D%26lt%3B%5C%2Fdiv%26gt%3B%26lt%3Bdiv%20class%3D%26quot%3Bcsl-right-inline%26quot%3B%20style%3D%26quot%3Bmargin%3A%200%20.4em%200%201.5em%3B%26quot%3B%26gt%3BMurray%20CA.%20In%20our%20hands%3A%20a%20plan%20to%20replace%20the%20welfare%20state.%20Washington%2C%20D.C.%26%23x202F%3B%3A%20Blue%20Ridge%20Summit%2C%20PA%3A%20AEI%20Press%26%23x202F%3B%3B%20Distributed%20to%20the%20trade%20by%20National%20Book%20Network%3B%202006.%26lt%3B%5C%2Fdiv%26gt%3B%5Cn%20%20%26lt%3B%5C%2Fdiv%26gt%3B%5Cn%26lt%3B%5C%2Fdiv%26gt%3B%22%2C%22data%22%3A%7B%22itemType%22%3A%22book%22%2C%22title%22%3A%22In%20our%20hands%3A%20a%20plan%20to%20replace%20the%20welfare%20state%22%2C%22creators%22%3A%5B%7B%22creatorType%22%3A%22author%22%2C%22firstName%22%3A%22Charles%20A.%22%2C%22lastName%22%3A%22Murray%22%7D%2C%7B%22creatorType%22%3A%22contributor%22%2C%22name%22%3A%22American%20Enterprise%20Institute%20for%20Public%20Policy%20Research%22%7D%5D%2C%22abstractNote%22%3A%22%22%2C%22date%22%3A%222006%22%2C%22language%22%3A%22%22%2C%22ISBN%22%3A%229780844742236%22%2C%22url%22%3A%22%22%2C%22collections%22%3A%5B%225FKAUV6X%22%5D%2C%22dateModified%22%3A%222023-03-09T04%3A12%3A08Z%22%7D%7D%2C%7B%22key%22%3A%22GMYC6QEW%22%2C%22library%22%3A%7B%22id%22%3A11239602%7D%2C%22meta%22%3A%7B%22creatorSummary%22%3A%22Bidadanure%22%2C%22parsedDate%22%3A%222019-05-11%22%2C%22numChildren%22%3A0%7D%2C%22bib%22%3A%22%26lt%3Bdiv%20class%3D%26quot%3Bcsl-bib-body%26quot%3B%20style%3D%26quot%3Bline-height%3A%201.35%3B%20%26quot%3B%26gt%3B%5Cn%20%20%26lt%3Bdiv%20class%3D%26quot%3Bcsl-entry%26quot%3B%20style%3D%26quot%3Bclear%3A%20left%3B%20%26quot%3B%26gt%3B%5Cn%20%20%20%20%26lt%3Bdiv%20class%3D%26quot%3Bcsl-left-margin%26quot%3B%20style%3D%26quot%3Bfloat%3A%20left%3B%20padding-right%3A%200.5em%3B%20text-align%3A%20right%3B%20width%3A%201em%3B%26quot%3B%26gt%3B%5B1%5D%26lt%3B%5C%2Fdiv%26gt%3B%26lt%3Bdiv%20class%3D%26quot%3Bcsl-right-inline%26quot%3B%20style%3D%26quot%3Bmargin%3A%200%20.4em%200%201.5em%3B%26quot%3B%26gt%3BBidadanure%20JU.%20The%20Political%20Theory%20of%20Universal%20Basic%20Income.%20Annu%20Rev%20Polit%20Sci%202019%3B22%3A481%26%23x2013%3B501.%20%26lt%3Ba%20class%3D%26%23039%3Bzp-DOIURL%26%23039%3B%20href%3D%26%23039%3Bhttps%3A%5C%2F%5C%2Fdoi.org%5C%2F10.1146%5C%2Fannurev-polisci-050317-070954%26%23039%3B%26gt%3Bhttps%3A%5C%2F%5C%2Fdoi.org%5C%2F10.1146%5C%2Fannurev-polisci-050317-070954%26lt%3B%5C%2Fa%26gt%3B.%26lt%3B%5C%2Fdiv%26gt%3B%5Cn%20%20%26lt%3B%5C%2Fdiv%26gt%3B%5Cn%26lt%3B%5C%2Fdiv%26gt%3B%22%2C%22data%22%3A%7B%22itemType%22%3A%22journalArticle%22%2C%22title%22%3A%22The%20Political%20Theory%20of%20Universal%20Basic%20Income%22%2C%22creators%22%3A%5B%7B%22creatorType%22%3A%22author%22%2C%22firstName%22%3A%22Juliana%20Uhuru%22%2C%22lastName%22%3A%22Bidadanure%22%7D%5D%2C%22abstractNote%22%3A%22Universal%20basic%20income%20%28UBI%29%20is%20a%20radical%20policy%20proposal%20of%20a%20monthly%20cash%20grant%20given%20to%20all%20members%20of%20a%20community%20without%20means%20test%2C%20regardless%20of%20personal%20desert%2C%20with%20no%20strings%20attached%2C%20and%2C%20under%20most%20proposals%2C%20at%20a%20sufficiently%20high%20level%20to%20enable%20a%20life%20free%20from%20economic%20insecurity.%20Once%20a%20utopian%20proposal%2C%20the%20policy%20is%20now%20widely%20discussed%20and%20piloted%20throughout%20the%20world.%20Among%20the%20various%20objections%20to%20the%20proposal%2C%20one%20concerns%20its%20moral%20adequacy%3A%20Isn%26%23039%3Bt%20it%20fundamentally%20unjust%20to%20give%20cash%20to%20all%20indiscriminately%20rather%20than%20to%20those%20who%20need%20it%20and%20deserve%20it%3F%20This%20article%20reviews%20the%20variety%20of%20strategies%20deployed%20by%20political%20theorists%20to%20posit%20that%20the%20proposal%20is%20in%20fact%20justified%2C%20or%20even%20required%2C%20by%20social%20justice.%20The%20review%20focuses%20mainly%20on%20the%20contemporary%20normative%20debate%20on%20UBI%5Cu2014roughly%20dating%20back%20to%20Philippe%20Van%20Parijs%26%23039%3Bs%20influential%20work%20in%20the%201990s%5Cu2014and%20is%20centered%20on%20the%20ideals%20of%20freedom%20and%20equality.%22%2C%22date%22%3A%222019-05-11%22%2C%22language%22%3A%22en%22%2C%22DOI%22%3A%2210.1146%5C%2Fannurev-polisci-050317-070954%22%2C%22ISSN%22%3A%221094-2939%2C%201545-1577%22%2C%22url%22%3A%22https%3A%5C%2F%5C%2Fwww.annualreviews.org%5C%2Fdoi%5C%2F10.1146%5C%2Fannurev-polisci-050317-070954%22%2C%22collections%22%3A%5B%225FKAUV6X%22%5D%2C%22dateModified%22%3A%222023-03-09T03%3A32%3A46Z%22%7D%7D%2C%7B%22key%22%3A%225J7QEVJT%22%2C%22library%22%3A%7B%22id%22%3A11239602%7D%2C%22meta%22%3A%7B%22creatorSummary%22%3A%22Ghoshal%22%2C%22parsedDate%22%3A%222016-01-18%22%2C%22numChildren%22%3A0%7D%2C%22bib%22%3A%22%26lt%3Bdiv%20class%3D%26quot%3Bcsl-bib-body%26quot%3B%20style%3D%26quot%3Bline-height%3A%201.35%3B%20%26quot%3B%26gt%3B%5Cn%20%20%26lt%3Bdiv%20class%3D%26quot%3Bcsl-entry%26quot%3B%20style%3D%26quot%3Bclear%3A%20left%3B%20%26quot%3B%26gt%3B%5Cn%20%20%20%20%26lt%3Bdiv%20class%3D%26quot%3Bcsl-left-margin%26quot%3B%20style%3D%26quot%3Bfloat%3A%20left%3B%20padding-right%3A%200.5em%3B%20text-align%3A%20right%3B%20width%3A%201em%3B%26quot%3B%26gt%3B%5B1%5D%26lt%3B%5C%2Fdiv%26gt%3B%26lt%3Bdiv%20class%3D%26quot%3Bcsl-right-inline%26quot%3B%20style%3D%26quot%3Bmargin%3A%200%20.4em%200%201.5em%3B%26quot%3B%26gt%3BGhoshal%20A.%20Robots%20may%20soon%20steal%20your%20job%20and%20that%26%23x2019%3Bs%20a%20good%20thing.%20TNW%20%7C%20Opinion%202016.%20%26lt%3Ba%20class%3D%26%23039%3Bzp-ItemURL%26%23039%3B%20href%3D%26%23039%3Bhttps%3A%5C%2F%5C%2Fthenextweb.com%5C%2Fnews%5C%2Frobots-may-soon-steal-your-job-and-thats-a-good-thing%26%23039%3B%26gt%3Bhttps%3A%5C%2F%5C%2Fthenextweb.com%5C%2Fnews%5C%2Frobots-may-soon-steal-your-job-and-thats-a-good-thing%26lt%3B%5C%2Fa%26gt%3B%20%28accessed%20March%208%2C%202023%29.%26lt%3B%5C%2Fdiv%26gt%3B%5Cn%20%20%26lt%3B%5C%2Fdiv%26gt%3B%5Cn%26lt%3B%5C%2Fdiv%26gt%3B%22%2C%22data%22%3A%7B%22itemType%22%3A%22webpage%22%2C%22title%22%3A%22Robots%20may%20soon%20steal%20your%20job%20and%20that%27s%20a%20good%20thing%22%2C%22creators%22%3A%5B%7B%22creatorType%22%3A%22author%22%2C%22firstName%22%3A%22Abhimanyu%22%2C%22lastName%22%3A%22Ghoshal%22%7D%5D%2C%22abstractNote%22%3A%22Roughly%207%20million%20jobs%20are%20expected%20to%20be%20lost%20in%20the%20next%20five%20years%20thanks%20to%20automation%20and%20the%20use%20of%20robots.%20But%20it%26%23039%3Bs%20not%20all%20bad.%22%2C%22date%22%3A%222016-01-18T14%3A09%3A55%2B00%3A00%22%2C%22url%22%3A%22https%3A%5C%2F%5C%2Fthenextweb.com%5C%2Fnews%5C%2Frobots-may-soon-steal-your-job-and-thats-a-good-thing%22%2C%22language%22%3A%22en%22%2C%22collections%22%3A%5B%229GGQIZXR%22%5D%2C%22dateModified%22%3A%222023-03-08T20%3A24%3A01Z%22%7D%7D%2C%7B%22key%22%3A%22C685G4DS%22%2C%22library%22%3A%7B%22id%22%3A11239602%7D%2C%22meta%22%3A%7B%22creatorSummary%22%3A%22Saura%20et%20al.%22%2C%22parsedDate%22%3A%222019%22%2C%22numChildren%22%3A0%7D%2C%22bib%22%3A%22%26lt%3Bdiv%20class%3D%26quot%3Bcsl-bib-body%26quot%3B%20style%3D%26quot%3Bline-height%3A%201.35%3B%20%26quot%3B%26gt%3B%5Cn%20%20%26lt%3Bdiv%20class%3D%26quot%3Bcsl-entry%26quot%3B%20style%3D%26quot%3Bclear%3A%20left%3B%20%26quot%3B%26gt%3B%5Cn%20%20%20%20%26lt%3Bdiv%20class%3D%26quot%3Bcsl-left-margin%26quot%3B%20style%3D%26quot%3Bfloat%3A%20left%3B%20padding-right%3A%200.5em%3B%20text-align%3A%20right%3B%20width%3A%201em%3B%26quot%3B%26gt%3B%5B1%5D%26lt%3B%5C%2Fdiv%26gt%3B%26lt%3Bdiv%20class%3D%26quot%3Bcsl-right-inline%26quot%3B%20style%3D%26quot%3Bmargin%3A%200%20.4em%200%201.5em%3B%26quot%3B%26gt%3BSaura%20JR%2C%20Reyes-Menendez%20A%2C%20Nostrand%20CV.%20Does%20SEO%20matter%20for%20early-stage%20startups%3F%20Insights%20from%20visual%20data%20mining%20and%20topic-modeling%20techniques%202019.%20%26lt%3Ba%20class%3D%26%23039%3Bzp-DOIURL%26%23039%3B%20href%3D%26%23039%3Bhttps%3A%5C%2F%5C%2Fdoi.org%5C%2F10.13140%5C%2FRG.2.2.10552.80645%26%23039%3B%26gt%3Bhttps%3A%5C%2F%5C%2Fdoi.org%5C%2F10.13140%5C%2FRG.2.2.10552.80645%26lt%3B%5C%2Fa%26gt%3B.%26lt%3B%5C%2Fdiv%26gt%3B%5Cn%20%20%26lt%3B%5C%2Fdiv%26gt%3B%5Cn%26lt%3B%5C%2Fdiv%26gt%3B%22%2C%22data%22%3A%7B%22itemType%22%3A%22journalArticle%22%2C%22title%22%3A%22Does%20SEO%20matter%20for%20early-stage%20startups%3F%20Insights%20from%20visual%20data%20mining%20and%20topic-modeling%20techniques%22%2C%22creators%22%3A%5B%7B%22creatorType%22%3A%22author%22%2C%22firstName%22%3A%22Jos%5Cu00e9%20Ram%5Cu00f3n%22%2C%22lastName%22%3A%22Saura%22%7D%2C%7B%22creatorType%22%3A%22author%22%2C%22firstName%22%3A%22Ana%22%2C%22lastName%22%3A%22Reyes-Menendez%22%7D%2C%7B%22creatorType%22%3A%22author%22%2C%22firstName%22%3A%22Chris%20Van%22%2C%22lastName%22%3A%22Nostrand%22%7D%5D%2C%22abstractNote%22%3A%22%22%2C%22date%22%3A%222019%22%2C%22language%22%3A%22en%22%2C%22DOI%22%3A%2210.13140%5C%2FRG.2.2.10552.80645%22%2C%22ISSN%22%3A%22%22%2C%22url%22%3A%22http%3A%5C%2F%5C%2Frgdoi.net%5C%2F10.13140%5C%2FRG.2.2.10552.80645%22%2C%22collections%22%3A%5B%22T6FRHTEN%22%5D%2C%22dateModified%22%3A%222023-03-08T17%3A16%3A32Z%22%7D%7D%2C%7B%22key%22%3A%22S4MJG79K%22%2C%22library%22%3A%7B%22id%22%3A11239602%7D%2C%22meta%22%3A%7B%22creatorSummary%22%3A%22Mordecai%22%2C%22parsedDate%22%3A%222021-11-24%22%2C%22numChildren%22%3A0%7D%2C%22bib%22%3A%22%26lt%3Bdiv%20class%3D%26quot%3Bcsl-bib-body%26quot%3B%20style%3D%26quot%3Bline-height%3A%201.35%3B%20%26quot%3B%26gt%3B%5Cn%20%20%26lt%3Bdiv%20class%3D%26quot%3Bcsl-entry%26quot%3B%20style%3D%26quot%3Bclear%3A%20left%3B%20%26quot%3B%26gt%3B%5Cn%20%20%20%20%26lt%3Bdiv%20class%3D%26quot%3Bcsl-left-margin%26quot%3B%20style%3D%26quot%3Bfloat%3A%20left%3B%20padding-right%3A%200.5em%3B%20text-align%3A%20right%3B%20width%3A%201em%3B%26quot%3B%26gt%3B%5B1%5D%26lt%3B%5C%2Fdiv%26gt%3B%26lt%3Bdiv%20class%3D%26quot%3Bcsl-right-inline%26quot%3B%20style%3D%26quot%3Bmargin%3A%200%20.4em%200%201.5em%3B%26quot%3B%26gt%3BMordecai%20D.%20Keywords%20vs%20Topics%20-%20Semantic%20SEO%20Strategy%20Overview%202021.%20%26lt%3Ba%20class%3D%26%23039%3Bzp-ItemURL%26%23039%3B%20href%3D%26%23039%3Bhttps%3A%5C%2F%5C%2Fwww.rankranger.com%5C%2Fblog%5C%2Fkeywords-vs-topics%26%23039%3B%26gt%3Bhttps%3A%5C%2F%5C%2Fwww.rankranger.com%5C%2Fblog%5C%2Fkeywords-vs-topics%26lt%3B%5C%2Fa%26gt%3B%20%28accessed%20March%203%2C%202023%29.%26lt%3B%5C%2Fdiv%26gt%3B%5Cn%20%20%26lt%3B%5C%2Fdiv%26gt%3B%5Cn%26lt%3B%5C%2Fdiv%26gt%3B%22%2C%22data%22%3A%7B%22itemType%22%3A%22webpage%22%2C%22title%22%3A%22Keywords%20vs%20Topics%20-%20Semantic%20SEO%20Strategy%20Overview%22%2C%22creators%22%3A%5B%7B%22creatorType%22%3A%22author%22%2C%22firstName%22%3A%22Darrell%22%2C%22lastName%22%3A%22Mordecai%22%7D%5D%2C%22abstractNote%22%3A%22As%20Google%20evolves%2C%20SEO%20strategies%20evolve%20with%20them.%20Targeting%20keywords%20has%20evolved%20to%20focus%20on%20topics.%20Discover%20why%20and%20how%20it%20changes%20your%20content%20strategy.%22%2C%22date%22%3A%22November%2024%2C%202021%22%2C%22url%22%3A%22https%3A%5C%2F%5C%2Fwww.rankranger.com%5C%2Fblog%5C%2Fkeywords-vs-topics%22%2C%22language%22%3A%22en%22%2C%22collections%22%3A%5B%22T6FRHTEN%22%5D%2C%22dateModified%22%3A%222023-03-03T17%3A34%3A03Z%22%7D%7D%2C%7B%22key%22%3A%22N79663K8%22%2C%22library%22%3A%7B%22id%22%3A11239602%7D%2C%22meta%22%3A%7B%22creatorSummary%22%3A%22Jung%22%2C%22parsedDate%22%3A%222022-07-05%22%2C%22numChildren%22%3A0%7D%2C%22bib%22%3A%22%26lt%3Bdiv%20class%3D%26quot%3Bcsl-bib-body%26quot%3B%20style%3D%26quot%3Bline-height%3A%201.35%3B%20%26quot%3B%26gt%3B%5Cn%20%20%26lt%3Bdiv%20class%3D%26quot%3Bcsl-entry%26quot%3B%20style%3D%26quot%3Bclear%3A%20left%3B%20%26quot%3B%26gt%3B%5Cn%20%20%20%20%26lt%3Bdiv%20class%3D%26quot%3Bcsl-left-margin%26quot%3B%20style%3D%26quot%3Bfloat%3A%20left%3B%20padding-right%3A%200.5em%3B%20text-align%3A%20right%3B%20width%3A%201em%3B%26quot%3B%26gt%3B%5B1%5D%26lt%3B%5C%2Fdiv%26gt%3B%26lt%3Bdiv%20class%3D%26quot%3Bcsl-right-inline%26quot%3B%20style%3D%26quot%3Bmargin%3A%200%20.4em%200%201.5em%3B%26quot%3B%26gt%3BJung%20M.%20Topics%20vs.%20Keywords%3A%20What%26%23x2019%3Bs%20More%20Important%20for%20SEO%3F%20ClearVoice%20Blog%202022.%20%26lt%3Ba%20class%3D%26%23039%3Bzp-ItemURL%26%23039%3B%20href%3D%26%23039%3Bhttps%3A%5C%2F%5C%2Fresources.clearvoice.com%5C%2Fblog%5C%2Ftopics-vs-keywords-whats-more-important-for-seo%5C%2F%26%23039%3B%26gt%3Bhttps%3A%5C%2F%5C%2Fresources.clearvoice.com%5C%2Fblog%5C%2Ftopics-vs-keywords-whats-more-important-for-seo%5C%2F%26lt%3B%5C%2Fa%26gt%3B%20%28accessed%20March%203%2C%202023%29.%26lt%3B%5C%2Fdiv%26gt%3B%5Cn%20%20%26lt%3B%5C%2Fdiv%26gt%3B%5Cn%26lt%3B%5C%2Fdiv%26gt%3B%22%2C%22data%22%3A%7B%22itemType%22%3A%22webpage%22%2C%22title%22%3A%22Topics%20vs.%20Keywords%3A%20What%5Cu2019s%20More%20Important%20for%20SEO%3F%22%2C%22creators%22%3A%5B%7B%22creatorType%22%3A%22author%22%2C%22firstName%22%3A%22Michael%22%2C%22lastName%22%3A%22Jung%22%7D%5D%2C%22abstractNote%22%3A%22Does%20building%20your%20blog%20around%20hot%20topics%20matter%20more%20than%20using%20high-value%20keywords%20in%20your%20content%3F%20Here%5Cu2019s%20how%20topics%20and%20keywords%20factor%20into%20SEO%20today.%22%2C%22date%22%3A%222022-07-05T12%3A00%3A26-06%3A00%22%2C%22url%22%3A%22https%3A%5C%2F%5C%2Fresources.clearvoice.com%5C%2Fblog%5C%2Ftopics-vs-keywords-whats-more-important-for-seo%5C%2F%22%2C%22language%22%3A%22en-US%22%2C%22collections%22%3A%5B%22T6FRHTEN%22%5D%2C%22dateModified%22%3A%222023-03-03T17%3A28%3A24Z%22%7D%7D%2C%7B%22key%22%3A%226TR26ZZ6%22%2C%22library%22%3A%7B%22id%22%3A11239602%7D%2C%22meta%22%3A%7B%22creatorSummary%22%3A%22Jeske%22%2C%22parsedDate%22%3A%222022-10-19%22%2C%22numChildren%22%3A0%7D%2C%22bib%22%3A%22%26lt%3Bdiv%20class%3D%26quot%3Bcsl-bib-body%26quot%3B%20style%3D%26quot%3Bline-height%3A%201.35%3B%20%26quot%3B%26gt%3B%5Cn%20%20%26lt%3Bdiv%20class%3D%26quot%3Bcsl-entry%26quot%3B%20style%3D%26quot%3Bclear%3A%20left%3B%20%26quot%3B%26gt%3B%5Cn%20%20%20%20%26lt%3Bdiv%20class%3D%26quot%3Bcsl-left-margin%26quot%3B%20style%3D%26quot%3Bfloat%3A%20left%3B%20padding-right%3A%200.5em%3B%20text-align%3A%20right%3B%20width%3A%201em%3B%26quot%3B%26gt%3B%5B1%5D%26lt%3B%5C%2Fdiv%26gt%3B%26lt%3Bdiv%20class%3D%26quot%3Bcsl-right-inline%26quot%3B%20style%3D%26quot%3Bmargin%3A%200%20.4em%200%201.5em%3B%26quot%3B%26gt%3BJeske%20S.%20The%20Difference%20Between%20Keywords%20and%20Topics.%20MarketMuse%20Blog%202022.%20%26lt%3Ba%20class%3D%26%23039%3Bzp-ItemURL%26%23039%3B%20href%3D%26%23039%3Bhttps%3A%5C%2F%5C%2Fblog.marketmuse.com%5C%2Fthe-difference-between-keywords-and-topics%5C%2F%26%23039%3B%26gt%3Bhttps%3A%5C%2F%5C%2Fblog.marketmuse.com%5C%2Fthe-difference-between-keywords-and-topics%5C%2F%26lt%3B%5C%2Fa%26gt%3B%20%28accessed%20March%203%2C%202023%29.%26lt%3B%5C%2Fdiv%26gt%3B%5Cn%20%20%26lt%3B%5C%2Fdiv%26gt%3B%5Cn%26lt%3B%5C%2Fdiv%26gt%3B%22%2C%22data%22%3A%7B%22itemType%22%3A%22webpage%22%2C%22title%22%3A%22The%20Difference%20Between%20Keywords%20and%20Topics%22%2C%22creators%22%3A%5B%7B%22creatorType%22%3A%22author%22%2C%22firstName%22%3A%22Stephen%22%2C%22lastName%22%3A%22Jeske%22%7D%5D%2C%22abstractNote%22%3A%22There%26%23039%3Bs%20a%20big%20difference%20between%20a%20topical%20approach%20and%20one%20relying%20on%20keywords.%20Discover%20how%20to%20use%20topics%20to%20quickly%20create%20expert-level%20content.%22%2C%22date%22%3A%222022-10-19T09%3A21%3A00-04%3A00%22%2C%22url%22%3A%22https%3A%5C%2F%5C%2Fblog.marketmuse.com%5C%2Fthe-difference-between-keywords-and-topics%5C%2F%22%2C%22language%22%3A%22en-US%22%2C%22collections%22%3A%5B%22T6FRHTEN%22%5D%2C%22dateModified%22%3A%222023-03-03T17%3A27%3A38Z%22%7D%7D%2C%7B%22key%22%3A%22Z3BTJQFU%22%2C%22library%22%3A%7B%22id%22%3A11239602%7D%2C%22meta%22%3A%7B%22creatorSummary%22%3A%22Montti%22%2C%22parsedDate%22%3A%222022-12-01%22%2C%22numChildren%22%3A0%7D%2C%22bib%22%3A%22%26lt%3Bdiv%20class%3D%26quot%3Bcsl-bib-body%26quot%3B%20style%3D%26quot%3Bline-height%3A%201.35%3B%20%26quot%3B%26gt%3B%5Cn%20%20%26lt%3Bdiv%20class%3D%26quot%3Bcsl-entry%26quot%3B%20style%3D%26quot%3Bclear%3A%20left%3B%20%26quot%3B%26gt%3B%5Cn%20%20%20%20%26lt%3Bdiv%20class%3D%26quot%3Bcsl-left-margin%26quot%3B%20style%3D%26quot%3Bfloat%3A%20left%3B%20padding-right%3A%200.5em%3B%20text-align%3A%20right%3B%20width%3A%201em%3B%26quot%3B%26gt%3B%5B1%5D%26lt%3B%5C%2Fdiv%26gt%3B%26lt%3Bdiv%20class%3D%26quot%3Bcsl-right-inline%26quot%3B%20style%3D%26quot%3Bmargin%3A%200%20.4em%200%201.5em%3B%26quot%3B%26gt%3BMontti%20R.%20A%20New%20Era%20Of%20Google%20Search%3A%20What%20It%20Means%20For%20SEO.%20Search%20Engine%20Journal%202022.%20%26lt%3Ba%20class%3D%26%23039%3Bzp-ItemURL%26%23039%3B%20href%3D%26%23039%3Bhttps%3A%5C%2F%5C%2Fwww.searchenginejournal.com%5C%2Fgoogle-search-new-era-seo%5C%2F311399%5C%2F%26%23039%3B%26gt%3Bhttps%3A%5C%2F%5C%2Fwww.searchenginejournal.com%5C%2Fgoogle-search-new-era-seo%5C%2F311399%5C%2F%26lt%3B%5C%2Fa%26gt%3B%20%28accessed%20March%203%2C%202023%29.%26lt%3B%5C%2Fdiv%26gt%3B%5Cn%20%20%26lt%3B%5C%2Fdiv%26gt%3B%5Cn%26lt%3B%5C%2Fdiv%26gt%3B%22%2C%22data%22%3A%7B%22itemType%22%3A%22webpage%22%2C%22title%22%3A%22A%20New%20Era%20Of%20Google%20Search%3A%20What%20It%20Means%20For%20SEO%22%2C%22creators%22%3A%5B%7B%22creatorType%22%3A%22author%22%2C%22firstName%22%3A%22Roger%22%2C%22lastName%22%3A%22Montti%22%7D%5D%2C%22abstractNote%22%3A%22The%20practice%20of%20SEO%20is%20tied%20to%20the%20evolving%20technology%20of%20Google%20search.%20Here%20are%20ways%20SEO%20should%20adapt%20to%20the%20evolution%20of%20search.%22%2C%22date%22%3A%222022-12-01T22%3A00%3A50%2B00%3A00%22%2C%22url%22%3A%22https%3A%5C%2F%5C%2Fwww.searchenginejournal.com%5C%2Fgoogle-search-new-era-seo%5C%2F311399%5C%2F%22%2C%22language%22%3A%22en%22%2C%22collections%22%3A%5B%22T6FRHTEN%22%5D%2C%22dateModified%22%3A%222023-03-03T17%3A26%3A40Z%22%7D%7D%2C%7B%22key%22%3A%222KQR796S%22%2C%22library%22%3A%7B%22id%22%3A11239602%7D%2C%22meta%22%3A%7B%22creatorSummary%22%3A%22Dean%22%2C%22parsedDate%22%3A%222020-01-21%22%2C%22numChildren%22%3A0%7D%2C%22bib%22%3A%22%26lt%3Bdiv%20class%3D%26quot%3Bcsl-bib-body%26quot%3B%20style%3D%26quot%3Bline-height%3A%201.35%3B%20%26quot%3B%26gt%3B%5Cn%20%20%26lt%3Bdiv%20class%3D%26quot%3Bcsl-entry%26quot%3B%20style%3D%26quot%3Bclear%3A%20left%3B%20%26quot%3B%26gt%3B%5Cn%20%20%20%20%26lt%3Bdiv%20class%3D%26quot%3Bcsl-left-margin%26quot%3B%20style%3D%26quot%3Bfloat%3A%20left%3B%20padding-right%3A%200.5em%3B%20text-align%3A%20right%3B%20width%3A%201em%3B%26quot%3B%26gt%3B%5B1%5D%26lt%3B%5C%2Fdiv%26gt%3B%26lt%3Bdiv%20class%3D%26quot%3Bcsl-right-inline%26quot%3B%20style%3D%26quot%3Bmargin%3A%200%20.4em%200%201.5em%3B%26quot%3B%26gt%3BDean%20B.%20On-Page%20SEO%3A%20The%20Definitive%20Guide%20%282022%29.%20Backlinko%202020.%20%26lt%3Ba%20class%3D%26%23039%3Bzp-ItemURL%26%23039%3B%20href%3D%26%23039%3Bhttps%3A%5C%2F%5C%2Fbacklinko.com%5C%2Fon-page-seo%26%23039%3B%26gt%3Bhttps%3A%5C%2F%5C%2Fbacklinko.com%5C%2Fon-page-seo%26lt%3B%5C%2Fa%26gt%3B%20%28accessed%20March%203%2C%202023%29.%26lt%3B%5C%2Fdiv%26gt%3B%5Cn%20%20%26lt%3B%5C%2Fdiv%26gt%3B%5Cn%26lt%3B%5C%2Fdiv%26gt%3B%22%2C%22data%22%3A%7B%22itemType%22%3A%22webpage%22%2C%22title%22%3A%22On-Page%20SEO%3A%20The%20Definitive%20Guide%20%282022%29%22%2C%22creators%22%3A%5B%7B%22creatorType%22%3A%22author%22%2C%22firstName%22%3A%22Brian%22%2C%22lastName%22%3A%22Dean%22%7D%5D%2C%22abstractNote%22%3A%22This%20is%20a%20complete%20guide%20to%20on-page%20SEO.%20Learn%20exactly%20how%20to%20optimize%20your%20titles%2C%20descriptions%20and%20content%20in%202022.%22%2C%22date%22%3A%222020-01-21T15%3A02%3A28%2B00%3A00%22%2C%22url%22%3A%22https%3A%5C%2F%5C%2Fbacklinko.com%5C%2Fon-page-seo%22%2C%22language%22%3A%22en-US%22%2C%22collections%22%3A%5B%22T6FRHTEN%22%5D%2C%22dateModified%22%3A%222023-03-03T17%3A25%3A32Z%22%7D%7D%2C%7B%22key%22%3A%22J4KZPTN8%22%2C%22library%22%3A%7B%22id%22%3A11239602%7D%2C%22meta%22%3A%7B%22creatorSummary%22%3A%22Wardle%22%2C%22parsedDate%22%3A%222021-06-02%22%2C%22numChildren%22%3A0%7D%2C%22bib%22%3A%22%26lt%3Bdiv%20class%3D%26quot%3Bcsl-bib-body%26quot%3B%20style%3D%26quot%3Bline-height%3A%201.35%3B%20%26quot%3B%26gt%3B%5Cn%20%20%26lt%3Bdiv%20class%3D%26quot%3Bcsl-entry%26quot%3B%20style%3D%26quot%3Bclear%3A%20left%3B%20%26quot%3B%26gt%3B%5Cn%20%20%20%20%26lt%3Bdiv%20class%3D%26quot%3Bcsl-left-margin%26quot%3B%20style%3D%26quot%3Bfloat%3A%20left%3B%20padding-right%3A%200.5em%3B%20text-align%3A%20right%3B%20width%3A%201em%3B%26quot%3B%26gt%3B%5B1%5D%26lt%3B%5C%2Fdiv%26gt%3B%26lt%3Bdiv%20class%3D%26quot%3Bcsl-right-inline%26quot%3B%20style%3D%26quot%3Bmargin%3A%200%20.4em%200%201.5em%3B%26quot%3B%26gt%3BWardle%20N.%20KEYWORDS%20VS.%20TOPICS%20IN%20SEO%202021.%20%26lt%3Ba%20class%3D%26%23039%3Bzp-ItemURL%26%23039%3B%20href%3D%26%23039%3Bhttps%3A%5C%2F%5C%2Fwww.tributemedia.com%5C%2Fblog%5C%2Fkeywords-vs.-topics-do-you-have-to-pick-a-side%26%23039%3B%26gt%3Bhttps%3A%5C%2F%5C%2Fwww.tributemedia.com%5C%2Fblog%5C%2Fkeywords-vs.-topics-do-you-have-to-pick-a-side%26lt%3B%5C%2Fa%26gt%3B.%26lt%3B%5C%2Fdiv%26gt%3B%5Cn%20%20%26lt%3B%5C%2Fdiv%26gt%3B%5Cn%26lt%3B%5C%2Fdiv%26gt%3B%22%2C%22data%22%3A%7B%22itemType%22%3A%22webpage%22%2C%22title%22%3A%22KEYWORDS%20VS.%20TOPICS%20IN%20SEO%22%2C%22creators%22%3A%5B%7B%22creatorType%22%3A%22author%22%2C%22firstName%22%3A%22Nikki%22%2C%22lastName%22%3A%22Wardle%22%7D%5D%2C%22abstractNote%22%3A%22%22%2C%22date%22%3A%22Jun%202%2C%202021%22%2C%22url%22%3A%22https%3A%5C%2F%5C%2Fwww.tributemedia.com%5C%2Fblog%5C%2Fkeywords-vs.-topics-do-you-have-to-pick-a-side%22%2C%22language%22%3A%22%22%2C%22collections%22%3A%5B%22T6FRHTEN%22%5D%2C%22dateModified%22%3A%222023-03-03T17%3A24%3A36Z%22%7D%7D%2C%7B%22key%22%3A%22GGKGZM5H%22%2C%22library%22%3A%7B%22id%22%3A11239602%7D%2C%22meta%22%3A%7B%22creatorSummary%22%3A%22Soulo%22%2C%22parsedDate%22%3A%222017-05-09%22%2C%22numChildren%22%3A0%7D%2C%22bib%22%3A%22%26lt%3Bdiv%20class%3D%26quot%3Bcsl-bib-body%26quot%3B%20style%3D%26quot%3Bline-height%3A%201.35%3B%20%26quot%3B%26gt%3B%5Cn%20%20%26lt%3Bdiv%20class%3D%26quot%3Bcsl-entry%26quot%3B%20style%3D%26quot%3Bclear%3A%20left%3B%20%26quot%3B%26gt%3B%5Cn%20%20%20%20%26lt%3Bdiv%20class%3D%26quot%3Bcsl-left-margin%26quot%3B%20style%3D%26quot%3Bfloat%3A%20left%3B%20padding-right%3A%200.5em%3B%20text-align%3A%20right%3B%20width%3A%201em%3B%26quot%3B%26gt%3B%5B1%5D%26lt%3B%5C%2Fdiv%26gt%3B%26lt%3Bdiv%20class%3D%26quot%3Bcsl-right-inline%26quot%3B%20style%3D%26quot%3Bmargin%3A%200%20.4em%200%201.5em%3B%26quot%3B%26gt%3BSoulo%20T.%20How%20many%20keywords%20can%20you%20rank%20for%20with%20one%20page%3F%20%28Ahrefs%26%23x2019%3B%20study%20of%203M%20searches%29%202017.%20%26lt%3Ba%20class%3D%26%23039%3Bzp-ItemURL%26%23039%3B%20href%3D%26%23039%3Bhttps%3A%5C%2F%5C%2Fahrefs.com%5C%2Fblog%5C%2Falso-rank-for-study%5C%2F%26%23039%3B%26gt%3Bhttps%3A%5C%2F%5C%2Fahrefs.com%5C%2Fblog%5C%2Falso-rank-for-study%5C%2F%26lt%3B%5C%2Fa%26gt%3B.%26lt%3B%5C%2Fdiv%26gt%3B%5Cn%20%20%26lt%3B%5C%2Fdiv%26gt%3B%5Cn%26lt%3B%5C%2Fdiv%26gt%3B%22%2C%22data%22%3A%7B%22itemType%22%3A%22webpage%22%2C%22title%22%3A%22How%20many%20keywords%20can%20you%20rank%20for%20with%20one%20page%3F%20%28Ahrefs%5Cu2019%20study%20of%203M%20searches%29%22%2C%22creators%22%3A%5B%7B%22creatorType%22%3A%22author%22%2C%22firstName%22%3A%22Tim%22%2C%22lastName%22%3A%22Soulo%22%7D%5D%2C%22abstractNote%22%3A%22%22%2C%22date%22%3A%22May%209%2C%202017%22%2C%22url%22%3A%22https%3A%5C%2F%5C%2Fahrefs.com%5C%2Fblog%5C%2Falso-rank-for-study%5C%2F%22%2C%22language%22%3A%22%22%2C%22collections%22%3A%5B%22T6FRHTEN%22%5D%2C%22dateModified%22%3A%222023-03-03T17%3A23%3A37Z%22%7D%7D%2C%7B%22key%22%3A%22TEAIUR5D%22%2C%22library%22%3A%7B%22id%22%3A11239602%7D%2C%22meta%22%3A%7B%22creatorSummary%22%3A%22Shelley%22%2C%22parsedDate%22%3A%222021-12-16%22%2C%22numChildren%22%3A0%7D%2C%22bib%22%3A%22%26lt%3Bdiv%20class%3D%26quot%3Bcsl-bib-body%26quot%3B%20style%3D%26quot%3Bline-height%3A%201.35%3B%20%26quot%3B%26gt%3B%5Cn%20%20%26lt%3Bdiv%20class%3D%26quot%3Bcsl-entry%26quot%3B%20style%3D%26quot%3Bclear%3A%20left%3B%20%26quot%3B%26gt%3B%5Cn%20%20%20%20%26lt%3Bdiv%20class%3D%26quot%3Bcsl-left-margin%26quot%3B%20style%3D%26quot%3Bfloat%3A%20left%3B%20padding-right%3A%200.5em%3B%20text-align%3A%20right%3B%20width%3A%201em%3B%26quot%3B%26gt%3B%5B1%5D%26lt%3B%5C%2Fdiv%26gt%3B%26lt%3Bdiv%20class%3D%26quot%3Bcsl-right-inline%26quot%3B%20style%3D%26quot%3Bmargin%3A%200%20.4em%200%201.5em%3B%26quot%3B%26gt%3BShelley%20R.%20Keywords%20vs%20Topics%3A%20Optimizing%20Your%20Pages%20for%20Search%202021.%20%26lt%3Ba%20class%3D%26%23039%3Bzp-ItemURL%26%23039%3B%20href%3D%26%23039%3Bhttps%3A%5C%2F%5C%2Fwww.smamarketing.net%5C%2Fblog%5C%2Ftopics-based-seo%26%23039%3B%26gt%3Bhttps%3A%5C%2F%5C%2Fwww.smamarketing.net%5C%2Fblog%5C%2Ftopics-based-seo%26lt%3B%5C%2Fa%26gt%3B.%26lt%3B%5C%2Fdiv%26gt%3B%5Cn%20%20%26lt%3B%5C%2Fdiv%26gt%3B%5Cn%26lt%3B%5C%2Fdiv%26gt%3B%22%2C%22data%22%3A%7B%22itemType%22%3A%22webpage%22%2C%22title%22%3A%22Keywords%20vs%20Topics%3A%20Optimizing%20Your%20Pages%20for%20Search%22%2C%22creators%22%3A%5B%7B%22creatorType%22%3A%22author%22%2C%22firstName%22%3A%22Ryan%22%2C%22lastName%22%3A%22Shelley%22%7D%5D%2C%22abstractNote%22%3A%22%22%2C%22date%22%3A%22Dec%2016%2C%202021%22%2C%22url%22%3A%22https%3A%5C%2F%5C%2Fwww.smamarketing.net%5C%2Fblog%5C%2Ftopics-based-seo%22%2C%22language%22%3A%22%22%2C%22collections%22%3A%5B%22T6FRHTEN%22%5D%2C%22dateModified%22%3A%222023-03-03T17%3A21%3A38Z%22%7D%7D%2C%7B%22key%22%3A%22V8ZD8R4S%22%2C%22library%22%3A%7B%22id%22%3A11239602%7D%2C%22meta%22%3A%7B%22creatorSummary%22%3A%22Zhu%20and%20Tan%22%2C%22parsedDate%22%3A%222012-09%22%2C%22numChildren%22%3A0%7D%2C%22bib%22%3A%22%26lt%3Bdiv%20class%3D%26quot%3Bcsl-bib-body%26quot%3B%20style%3D%26quot%3Bline-height%3A%201.35%3B%20%26quot%3B%26gt%3B%5Cn%20%20%26lt%3Bdiv%20class%3D%26quot%3Bcsl-entry%26quot%3B%20style%3D%26quot%3Bclear%3A%20left%3B%20%26quot%3B%26gt%3B%5Cn%20%20%20%20%26lt%3Bdiv%20class%3D%26quot%3Bcsl-left-margin%26quot%3B%20style%3D%26quot%3Bfloat%3A%20left%3B%20padding-right%3A%200.5em%3B%20text-align%3A%20right%3B%20width%3A%201em%3B%26quot%3B%26gt%3B%5B1%5D%26lt%3B%5C%2Fdiv%26gt%3B%26lt%3Bdiv%20class%3D%26quot%3Bcsl-right-inline%26quot%3B%20style%3D%26quot%3Bmargin%3A%200%20.4em%200%201.5em%3B%26quot%3B%26gt%3BZhu%20X%2C%20Tan%20Z.%20SEO%20Keyword%20Analysis%20and%20Its%20Application%20in%20Website%20Editing%20System.%202012%208th%20International%20Conference%20on%20Wireless%20Communications%2C%20Networking%20and%20Mobile%20Computing%2C%202012%2C%20p.%201%26%23x2013%3B4.%20%26lt%3Ba%20class%3D%26%23039%3Bzp-DOIURL%26%23039%3B%20href%3D%26%23039%3Bhttps%3A%5C%2F%5C%2Fdoi.org%5C%2F10.1109%5C%2FWiCOM.2012.6478670%26%23039%3B%26gt%3Bhttps%3A%5C%2F%5C%2Fdoi.org%5C%2F10.1109%5C%2FWiCOM.2012.6478670%26lt%3B%5C%2Fa%26gt%3B.%26lt%3B%5C%2Fdiv%26gt%3B%5Cn%20%20%26lt%3B%5C%2Fdiv%26gt%3B%5Cn%26lt%3B%5C%2Fdiv%26gt%3B%22%2C%22data%22%3A%7B%22itemType%22%3A%22conferencePaper%22%2C%22title%22%3A%22SEO%20Keyword%20Analysis%20and%20Its%20Application%20in%20Website%20Editing%20System%22%2C%22creators%22%3A%5B%7B%22creatorType%22%3A%22author%22%2C%22firstName%22%3A%22Xinjuan%22%2C%22lastName%22%3A%22Zhu%22%7D%2C%7B%22creatorType%22%3A%22author%22%2C%22firstName%22%3A%22Zhiqiang%22%2C%22lastName%22%3A%22Tan%22%7D%5D%2C%22abstractNote%22%3A%22A%20keyword%20choice%20and%20analysis%20approach%20in%20SEO%20is%20studied%20to%20deal%20with%20the%20issues%20such%20as%20low%20efficiency%2C%20poor%20reliability%20and%20instability%20optimization%20in%20artificial%20SEO%20processing%20in%20this%20paper.%20A%20keyword%20expansion%20method%20is%20proposed%20by%20reversing%20search%20engine%26%23039%3Bs%20related%20search%20keywords%20to%20meet%20user%26%23039%3Bs%20requirements.%20C4.5%20algorithm%20is%20adopted%20to%20analyze%20the%20main%20factor%20infecting%20the%20competition%20result%20of%20keywords%20and%20predict%20their%20competition%20from%20historical%20SEO%20data.%20A%20website%20editing%20system%20is%20authored%20in%20which%20backward%20spider%20and%20text%20extraction%20technology%20is%20utilized%20to%20collect%20information.%20In%20this%20case%2C%20real-time%20SEO%20factor%20analysis%20could%20be%20automatically%20done%20and%20feedback%20to%20the%20system%20to%20improve%20the%20productivity%20and%20efficiency%20in%20SEO%20processing.%22%2C%22date%22%3A%222012-09%22%2C%22proceedingsTitle%22%3A%222012%208th%20International%20Conference%20on%20Wireless%20Communications%2C%20Networking%20and%20Mobile%20Computing%22%2C%22conferenceName%22%3A%222012%208th%20International%20Conference%20on%20Wireless%20Communications%2C%20Networking%20and%20Mobile%20Computing%22%2C%22language%22%3A%22%22%2C%22DOI%22%3A%2210.1109%5C%2FWiCOM.2012.6478670%22%2C%22ISBN%22%3A%22%22%2C%22url%22%3A%22%22%2C%22collections%22%3A%5B%22T6FRHTEN%22%5D%2C%22dateModified%22%3A%222023-03-03T17%3A19%3A37Z%22%7D%7D%5D%7D
[1]
Kleinaltenkamp M, Prohl-Schwenke K, Elgeti L. Customer Success Management: Helping Business Customers Achieve Their Goals. Cham: Springer International Publishing; 2023. https://doi.org/10.1007/978-3-031-26178-7.
[1]
Hamilton L, Martin-West S. Universal Basic Income, Poverty, and Social Justice: A Moral and Economic Imperative for Social Workers. Social Work 2019;64:321–8.
https://doi.org/10.1093/sw/swz028 .
[1]
Rizvanović B, Zutshi A, Grilo A, Nodehi T. Linking the potentials of extended digital marketing impact and start-up growth: Developing a macro-dynamic framework of start-up growth drivers supported by digital marketing. Technological Forecasting and Social Change 2023;186:122128.
https://doi.org/10.1016/j.techfore.2022.122128 .
[1]
Giardino C, Wang X, Abrahamsson P. Why Early-Stage Software Startups Fail: A Behavioral Framework. In: Lassenius C, Smolander K, editors. Software Business. Towards Continuous Value Delivery, vol. 182, Cham: Springer International Publishing; 2014, p. 27–41. https://doi.org/10.1007/978-3-319-08738-2_3.
[1]
Ferrazzi K, Raz T. Never eat alone: and other secrets to success, one relationship at a time. Expanded and updated [edition]. New York: Crown Business; 2014.
[1]
Smil V. Transforming the twentieth century: technical innovations and their consequences. Oxford ; New York: Oxford University Press; 2006.
[1]
Baye MR, De Los Santos B, Wildenbeest MR. Search Engine Optimization: What Drives Organic Traffic to Retail Sites? Journal of Economics & Management Strategy 2016;25:6–31.
https://doi.org/10.1111/jems.12141 .
[1]
Davenport TH. The Rise of Job-Killing Automation? Not So Fast. Wall Street Journal 2015.
[1]
Cole J. Milton Friedman on Income Inequality. Journal of Markets and Morality 2008;11:239–53.
[1]
Murray CA. In our hands: a plan to replace the welfare state. Washington, D.C. : Blue Ridge Summit, PA: AEI Press ; Distributed to the trade by National Book Network; 2006.
[1]
Zhu X, Tan Z. SEO Keyword Analysis and Its Application in Website Editing System. 2012 8th International Conference on Wireless Communications, Networking and Mobile Computing, 2012, p. 1–4.
https://doi.org/10.1109/WiCOM.2012.6478670 .

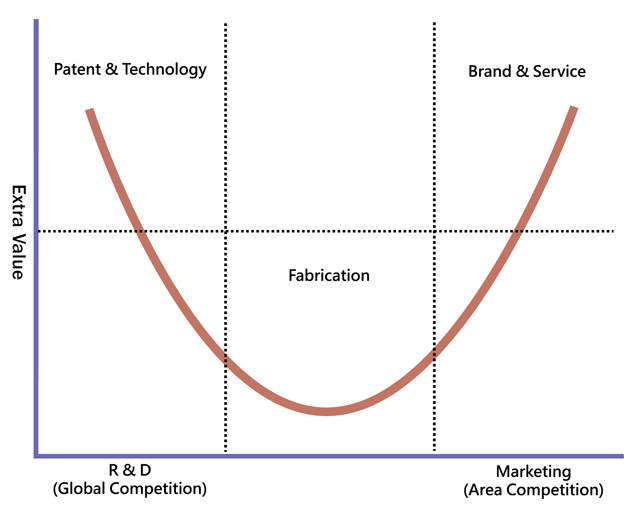

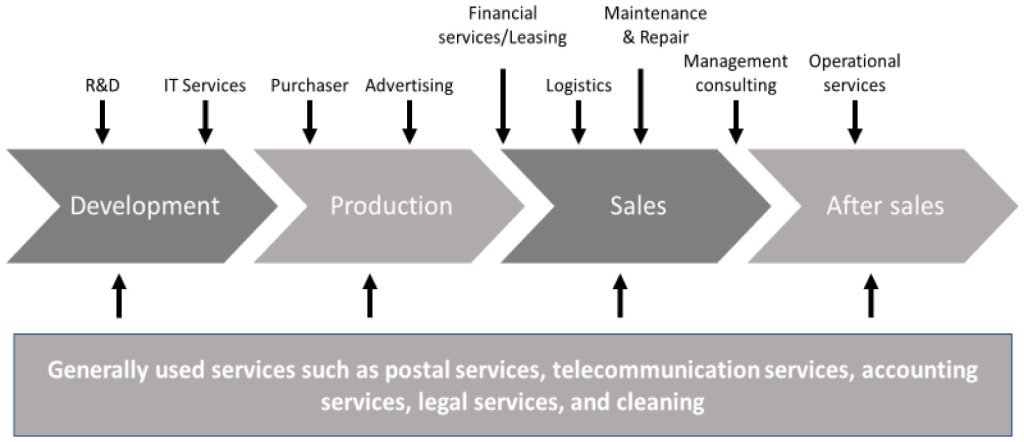


Responses