
Technical SEO Audit Presentation Template + 3 Best SEO Reporting Software!

Ever struggled to present a technical SEO audit to higher-ups without their eyes glazing over? In today’s data-driven world, even the best SEO work can get lost in translation.
This guide will grab your attention with proven tools, spark interest in crafting compelling audit presentations, build desire by showcasing time-saving templates, and prompt action so you can confidently wow marketing directors and CEOs.
Read on to transform complex SEO findings into insights that truly resonate.
Content Overview:
Best SEO Reporting Software
Choosing the right software is crucial for delivering clear and actionable SEO audit reports. The best tools pull together your data, automate tedious tasks, and present results in a way that anyone can understand.
Here are three top SEO reporting platforms (with no bias – just the cream of the crop) that SEO professionals rely on:
- Google Looker Studio (Data Studio) – A free, flexible dashboard builder that connects with 1,000+ data sources to create visually appealing SEO reports. Looker Studio lets you combine Google Analytics, Search Console, and more into one interactive dashboard. It’s great for merging SEO, PPC, and marketing data in one place, and it comes with pre-built templates for quick setup. (Price: Free; Pro plan available.)
- Semrush – An all-in-one SEO suite ideal for professionals who want to track, analyze, and report SEO performance in one place. Semrush’s Site Audit tool finds technical issues, and its reporting features let you create white-label PDF reports with your findings. You can monitor keyword rankings, backlinks, site health scores, and more, then easily compile these into comprehensive reports for stakeholders. (Price: Paid plans; offers free trials.)
- AgencyAnalytics – A reporting platform built for agencies and teams to share real-time dashboards with clients. It integrates 80+ data sources (SEO, PPC, social, email) into one client-friendly interface. AgencyAnalytics is known for its customizable white-label reports – you can add your logo, choose the metrics that matter, and even give clients their own login to view live SEO dashboards 24/7. Automated report scheduling is a huge plus, and the tool is very easy for non-technical clients to grasp. (Price: Starts at ~$50-$100/month, with free trial.)
Each of these tools can save you hours of manual work. The key is finding the one that fits your workflow – whether it’s the flexibility of Looker Studio, the depth of Semrush’s data, or the client-focused features of AgencyAnalytics.
All three help turn raw SEO data into reports that tell a story and demonstrate value to your audience.
How to Create a Technical SEO Audit Presentation?
Creating a technical SEO audit presentation is about translating your in-depth website analysis into a clear, executive-friendly story.
Start by considering your audience: a CEO or marketing director doesn’t need to see every crawl error; they need the big picture and why it matters.
- Focus on Key Insights: Don’t overload with data. Narrow down the primary SEO KPIs and findings you want to highlight – for example, overall organic traffic trends, critical technical issues affecting indexing, page speed improvements, and top opportunities. This keeps the presentation focused on what truly impacts the business (e.g. traffic, rankings, conversions).
- Use a Logical Structure: Organize your audit findings into a story that flows. A typical technical SEO audit presentation will include: Summary of Site Health, Key SEO Metrics (traffic, rankings, etc.), Indexing & Crawlability (index status, any crawl errors), On-Page Factors (meta tags, content optimization), Off-Page Factors (backlink profile and authority), Site Performance (page speed, Core Web Vitals), and an SEO Recommendations/Action Plan. This structure ensures you cover all important areas. Start with the high-level summary, then dive into each category of issues and improvements, and end with clear recommendations.
- Make It Visual: A picture is worth a thousand words, especially to non-technical audiences. Include simple charts and infographics to illustrate your points – for instance, a pie chart of crawl issues by type, a line graph of site speed improvements, or before-and-after screenshots of fixed problems. Visuals help to communicate complex concepts quickly and keep your audience engaged. (Many SEO tools will generate these for you, or you can grab screenshots from your SEO software.)
- Tie SEO Issues to Business Impact: Frame your findings in terms of outcomes. If you found that slow page speed was hurting conversions, say that explicitly and perhaps show a correlation. If fixing broken links led to an uptick in organic traffic, point that out. This approach answers the “so what?” for each issue, making the value of your SEO work clear.
- Keep the Language Accessible: Avoid hardcore technical jargon when presenting to executives. Instead of “We need to minify JavaScript and leverage browser caching,” say “We’ll speed up the site’s load time, which should improve user experience and Google rankings.” The goal is to educate, not overwhelm. You can always have an appendix or separate document for developers with the gritty details.
By following these guidelines, you’ll create a presentation that not only shares the technical audit results but does so in a compelling way that resonates with decision-makers. Remember, you’re not just reporting data – you’re telling the story of the website’s health and how to improve it.
Download Best Technical SEO Audit Presentation Templates
Don’t want to start from a blank slide deck? You’re in luck – there are excellent pre-made templates for technical SEO audit presentations.
Using a professional template saves you time and ensures you don’t miss any important sections of the audit. Many templates are also designed to be visually engaging, which is a huge plus.
One highly-rated option is the SEO Audit Presentation template from PandaDoc, which is free to use. It was created for informing clients about their website’s performance and improvement opportunities. This particular template has been used thousands of times by agencies, indicating its quality and usefulness.
It includes slides for all the critical components of an audit. For example, its table of contents covers everything from an SEO Report Summary and Key Metrics to detailed sections on Organic vs. Branded Traffic, Indexing, Content, On-Page/Off-Page Factors, Backlinks, Site Performance, and finally an SEO Recommendation & Action Plan.
In other words, it’s a comprehensive framework that guides you to touch on every important technical SEO area in your presentation.
Aside from PandaDoc, you can find great technical SEO audit templates on presentation marketplaces and SEO communities. Slidesgo, for instance, offers a free SEO Audit Proposal template, and platforms like GraphicRiver or SlideModel have professionally designed SEO report decks.
Even Google’s own Looker Studio has community templates for SEO reports that you can adapt. When choosing a template, look for these features: a visually clean design, placeholders for your data (charts/tables), and sections that align with the key audit areas (site health, issues, recommendations, etc.).
Pro tip: Always customize the template to match your client’s context and your findings. Templates provide a starting point, but you’ll want to add your personal commentary (more on that soon) and maybe tweak the slide order based on what’s most important for your particular audit.
With the right template in hand, you can quickly plug in your data and focus more on the insights and narrative, rather than design work.
Build Dashboards & Reports Your Way
Every SEO team has its own goals and metrics, so one-size-fits-all reports often fall short. The beauty of modern SEO reporting software is that you can build dashboards and reports your way – tailored to the needs of your project or client.
Instead of jumping between Google Analytics, Search Console, your crawler, and other tools, a custom dashboard lets you bring all that data together in one place for a cohesive view.
When setting up your own SEO audit report or dashboard, keep these points in mind:
- Consolidate Multiple Data Sources: Great dashboards pull in data from everywhere – your rank tracker, site auditor, Google Analytics, Google Search Console, etc. By consolidating these streams into a single report, you create a holistic narrative of SEO performance rather than disjointed stats. For example, you might show how a spike in crawl errors (from a site audit tool) correlates with a drop in organic traffic (from Analytics). Centralizing data helps connect the dots.
- Choose Meaningful Metrics: Customize which metrics and KPIs to highlight. If you’re reporting to a CEO, you might emphasize overall organic traffic, conversion value of organic visitors, and critical technical issues resolved. If it’s a more hands-on marketing manager, you might include deeper metrics like index coverage, page speed scores, or backlink growth. The key is to avoid clutter – include only what adds value. (A good rule from Google’s Looker Studio playbook: “Choose exactly which metrics to show” and leave out the rest.)
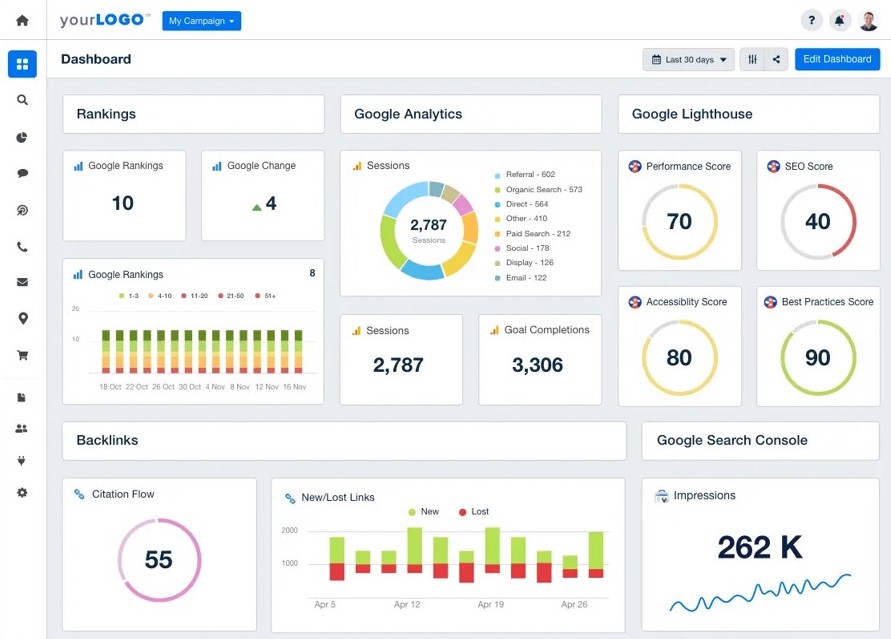
- Design for Clarity: Take advantage of your software’s layout options to make the report easy to read. Use headings, sections, and visual widgets (charts, graphs, gauges) to break up data into logical chunks. Most tools have drag-and-drop editors so you can arrange the report in a way that tells the story best. For instance, you might start with a high-level “SEO Health Score” gauge, followed by charts for key categories like Performance, Indexing, and Links. A well-designed dashboard means at a glance, the viewer knows where to look and what the key message is.
- White-Label and Brand It: If you’re an agency or consultant, white-labeling your reports can add a professional touch. Good SEO reporting platforms let you add your logo, brand colors, and even host reports on a custom domain. This way, your reports reinforce your brand’s value. It “aligns your agency’s identity with the progress you’re presenting” and leaves a lasting impression. Plus, a polished, branded report can be more convincing for higher-ups who equate quality of presentation with quality of work.
Perhaps you prefer interactive dashboards over slide decks – if so, you can even provide clients with a live reporting dashboard. With tools like AgencyAnalytics, clients can get their own login to view real-time SEO metrics anytime.
Meanwhile, platforms like Looker Studio or Whatagraph allow you to share live, always-updated reports via a link. This on-demand transparency is often appreciated by executives who want to check progress without scheduling a meeting.
In short, building dashboards “your way” means you highlight the data that matters, in a format that works for your audience. Whether it’s a monthly PDF or a live online dashboard, customization ensures your technical SEO audit results are both accessible and impactful.
Add Expert Commentary and SEO Insights
Data alone doesn’t tell the full story – your commentary and insights are what give the data meaning. After running the technical audit and compiling all the charts, it’s critical to add a human touch.
In fact, one key part of reporting is adding your own expert commentary to highlight progress, explain changes, and call out wins. This is where you shine as the SEO expert, interpreting the results for your audience.

When adding commentary to your SEO audit presentation or report, consider these approaches:
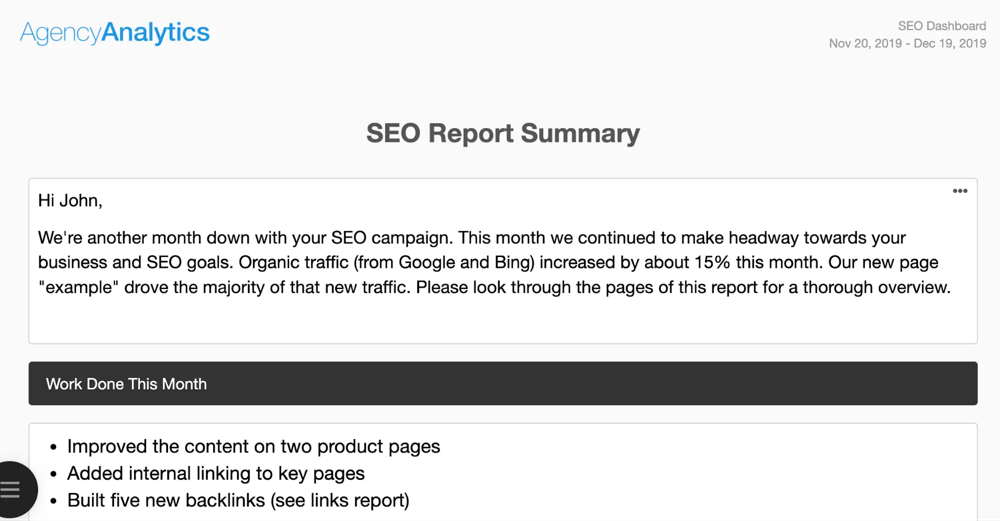
- Summarize the Month/Quarter: Begin with a brief summary of what happened during the period. For example, “This month we made significant headway on technical fixes. Organic traffic from Google increased by 15%, reaching a new high, after we improved site speed and fixed broken links.” A friendly intro like this (perhaps in a “SEO Report Summary” slide or section) sets the stage and makes the report feel personalized. In our agency’s report template, we often open with a note like “Hi John, we’re another month down on your SEO campaign… organic traffic increased by X%…” to ensure the client/executive immediately sees the positive progress (and it reads like a brief letter rather than a dry report).
- Highlight Key Improvements: Point out what changed and why it’s good. If your audit shows, say, 50 pages were removed from the index due to a fix of duplicate URLs, explain how that cleanup improved the site’s overall health score. Or if mobile usability errors dropped to zero after a site redesign, call that out. This is essentially connecting the dots – “We did X, and you can see the benefit in metric Y.” For instance, “After fixing the canonical tag issues, we saw an uptick in indexed pages and a 10% boost in Google impressions the following week,” linking cause and effect. This kind of insight goes beyond the automated data and shows the value of your expertise.
- Use Visual Annotations: As the image above illustrates, adding notes or callouts on graphs can be powerful. Many SEO reporting tools let you insert annotations on charts (or you can do it manually). Marking the timeline with events – e.g. “Site speed optimized here”, “Migrated to new server here” – helps executives see how your actions influenced trends. It literally turns data into a story. For example, an upward traffic line with a note “Launched backlink campaign” and later a peak labeled “New all-time traffic record 🎉” makes it clear that your efforts drove results. It also makes the report more engaging to read.
- Explain Issues & Next Steps in Plain English: When presenting technical findings, always translate what it means for the business and what you recommend doing. Instead of just saying “High XML sitemap errors”, add an insight: “Google can’t find important pages because of sitemap errors – we’ll fix these to ensure all key pages get indexed.” And follow it up with what you plan to do next: “Next month, we’ll focus on fixing these errors and then request Google to re-crawl the site, which should improve indexation.” This approach of coupling a finding with a recommendation is often called adding context. It shows you’re proactively thinking about solutions, not just pointing out problems.
Ultimately, adding commentary transforms your report from a raw data dump into a consultative deliverable. It “contextualizes the raw data for clients and strengthens your value proposition” as an SEO expert.
The marketing director or CEO reading your report will come away not just with numbers, but with an understanding of what those numbers mean and confidence that you know how to drive further improvements.
Your insights are the bridge between technical jargon and business value – so don’t shy away from spelling it out in your presentation!
Schedule Automated SEO Reports
Let’s face it: producing reports can be time-consuming if done manually. Many SEO managers recall spending half a day (or more) every week just gathering data from different platforms and pasting it into a report.
The good news is that today’s best SEO reporting software can automate this process. Scheduling automated SEO reports is a game-changer for efficiency and consistency.
Save Time with Scheduling: Rather than manually pulling data each time, you can set up your software to send reports on a recurring schedule – e.g. a weekly SEO health report every Monday morning, or a monthly performance summary on the 1st of each month. Most platforms support this with a few clicks.
For instance, you can configure a PDF report to automatically compile and email to your CEO at the end of each month. This means no more last-minute scrambling on Friday afternoon; the report goes out like clockwork while you focus on other tasks.
Keep Everyone in the Loop: Automated reports ensure that your team and stakeholders stay updated on SEO progress without you needing to remember to send it. It’s easy to “set and forget.”
As noted in an AgencyAnalytics guide, you can schedule regular exports (weekly, monthly, etc.) and have them delivered to clients or bosses automatically. This steady cadence of reporting helps build transparency.
For example, the marketing director will consistently see that site health chart inching upward or organic traffic growing, reinforcing the value of your SEO efforts over time.
Custom Frequency and Formats: Good reporting tools let you customize how and when the reports are sent. You might choose a high-level summary report for the C-suite monthly, and a more detailed technical report for the dev team bi-weekly.
You can often choose multiple formats too: perhaps an interactive dashboard link for daily access, plus a PDF snapshot for email.
And if something big happens (say, a Google algorithm update causes a traffic swing), you can always trigger an on-demand report to address it – but your regular automated schedule covers the routine updates.
Don’t Forget Alerts: In addition to scheduled reports, consider setting up automated alerts for critical technical issues. Many tools can ping you (and the client) if, for example, the site goes down, or a big spike in 404 errors is detected.
These aren’t “presentation” materials per se, but they complement your reporting by ensuring urgent technical SEO problems are flagged in real-time. This way, there are no nasty surprises in between the scheduled report deliveries.
In summary, scheduling automated SEO reports turns reporting from a reactive chore into a proactive communication strategy. It guarantees that comprehensive technical audit findings and performance metrics reach the right people at the right intervals.
Plus, it frees you up – you can spend your time analyzing results and planning improvements, rather than copying and pasting data. As one SEO lead quipped, automation in reporting “gave me back my Fridays,” letting them focus on strategy instead of spreadsheets.
Embrace these features in your SEO reporting toolkit, and you’ll maintain transparency and momentum with minimal effort.
Conclusion
Delivering a technical SEO audit presentation that resonates with CEOs and marketing directors is all about combining robust data with a compelling narrative. By leveraging the right reporting software, you ensure accuracy and save time through automation.
By using well-crafted templates and custom dashboards, you present information in a polished, digestible format. And by adding your expert commentary, you bridge the gap between technical details and business value.
In practice, a comprehensive technical SEO audit report might show that a website’s health score improved from 65% to 85% after a month of fixes – but it’s your explanation that “this improvement removed barriers to Google indexing, which should boost our organic traffic next quarter” that will make the CEO take notice.
With the tools, templates, and tips outlined above, you’re equipped to not only find and fix SEO issues but also to communicate those wins in a way that earns you trust and buy-in.
So go ahead – try out one of the recommended SEO reporting tools, download a presentation template, and start turning your next technical SEO audit into a story of growth and opportunity.
By doing so, you’ll transform dry audit findings into powerful insights that drive decision-makers to take action (and maybe even applaud your effort!). Here’s to delivering SEO audit presentations that inform, impress, and inspire. Happy Reporting!


Responses